- 博客/
Rancher 开启监控后,exporter/metrics 的添加说明 (二)
Table of Contents
环境说明#
上期介绍了rancher prometheus operator的安装和基础 targets 的修复工作。有的时候我们抓取的 exporter metrics 并不在同集群且与集群没有任何关联时,应该怎么和 ranchermonitor进行关联配置呢?下面文档将配置展示部署外部exporter, 的安装说明、指标抓取、 和监控系统的关联。
exporter 列表#
此
exporter列表使用文档为不同时期 整理归纳,阅读过程中存在一定的时间差异。被官方文档收录收集的完整exporter 列表查看。
scripts exporter#
安装配置#
为保证 exporter
灵活性,部署未使用容器化部署
下载软件包
wget https://github.com/adhocteam/script_exporter/releases/download/v1.1.0/script_exporter-1.1.0.linux-amd64.tar.gz

tar xf script_exporter-1.1.0.linux-amd64.tar.gz

mkdir -p /application/script_exporter/{conf,bin}

cp script_exporter-1.1.0.linux-amd64/script_exporter /application/script_exporter/bin/
创建相关配置文件并测试启动
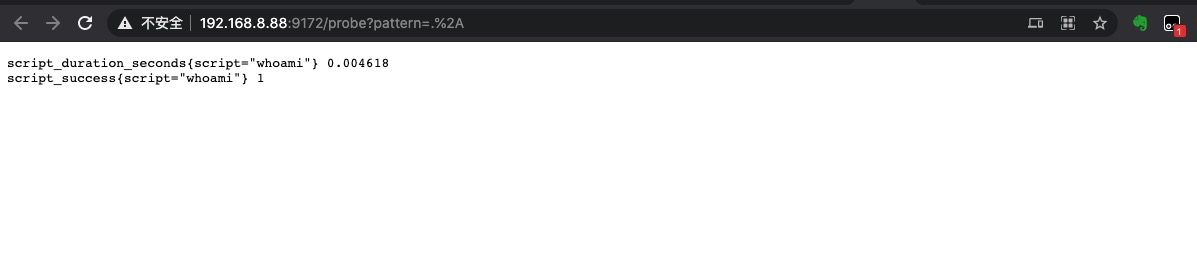
cat > /application/script_exporter/conf/script-exporter.yml << EOF
scripts:
  # 此配置文件 创建一个whoami的脚本 当程序不是root用户执行时抛出异常
  - name: 'whoami'
    script: if [ \`whoami\` != 'root' ];then exit 1 ;fi
EOF

# 使用 root 用户启动测试程序
/application/script_exporter/bin/script_exporter -config.file /application/script_exporter/conf/script-exporter.yml # 测试启动

curl http://localhost:9172/probe?pattern=.*  # 测试触发脚本的 metrics 指标暴露
script_duration_seconds{script="whoami"} 0.002529
script_success{script="whoami"} 1  # 这里由于我使用的是 root 启动的 指标显示为 1,下面我们尝试更为 非 root 用户启动看看

useradd exporter  # 添加测试用户  exporter

su - exporter # 切换为 exporter 用户启动程序

# 使用 exporter 用户启动测试程序
/application/script_exporter/bin/script_exporter -config.file /application/script_exporter/conf/script-exporter.yml

curl http://localhost:9172/probe?pattern=.*  # 再次触发脚本执行
script_duration_seconds{script="whoami"} 0.004814
script_success{script="whoami"} 0 # 可以放回为 非 0,即错误验证码
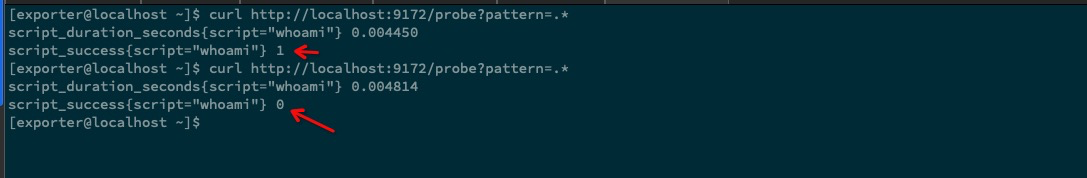
从上面测试的结果我们可以得出结论,那就是
执行脚本返回了非0状态码metrics 对象 指标项就会是0, 那么我们更具此条规律添加脚本即可。下面示例展示一个生产环境使用的 配置文件。cat script-exporter.yml scripts: - name: '1.44-raid-check' script: if ! ssh 192.168.1.44 "if [ \`MegaCli -PDList -aAll -NoLog | grep 'Firmware state'|wc -l \` -ne \`MegaCli -PDList -aAll -NoLog | egrep 'Online,|Hotspare,'|wc -l\` ] ;then exit 1 ;fi";then exit 1 ;fi此脚本,使用 ssh 远程至目标机器
192.168.1.44,检查磁盘整列raid是否有掉盘情况,远程使用ssh-keygen & ssh-copy-id做了免密钥处理,所有不需要输入密码。
配置为 systemctl 服务,并设置开启自启动#
注意使用
root启动进程的话,存在一定的安全隐患,那么可以使用 特定的用户进行启动,来规避安全风险。groupadd -r exporter # useradd -r -g exporter -s /sbin/nologin -M exporter # 此操作,设置 exporter 无法使用终端,为保证配置灵活性不建议执行。 chown exporter:exporter -R /application/script_exporter/ # 将文件对应赋予给此用户
cat > /usr/lib/systemd/system/script-exporter.service << EOF
[Unit]
Description=Script_Exporter
Documentation=https://github.com/adhocteam/script_exporter
After=network.target
[Service]
Type=simple
User=root
ExecStart=/application/script_exporter/bin/script_exporter -config.file /application/script_exporter/conf/script-exporter.yml -web.listen-address=:9172 -web.telemetry-path=/metrics -config.shell=/bin/sh
Restart=on-failure
[Install]
WantedBy=multi-user.target
EOF
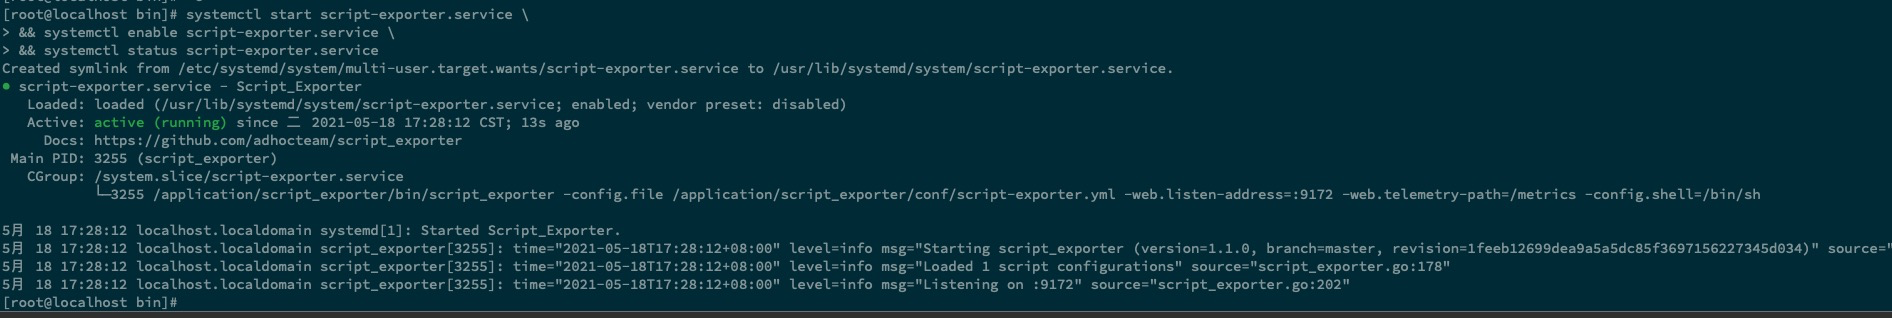
systemctl start script-exporter.service \
&& systemctl enable script-exporter.service \
&& systemctl status script-exporter.service
关联 prometheus 指标抓取#
此示例使用普通的 prometheus,配置文件进行关联
  - job_name: 'script_exporter'
    scrape_interval: 15s
    metrics_path: /probe
    params:
      pattern: ['.']
    static_configs:
      - targets: ['exporter_ip:exporter_port'']
        labels: demo
          instance: 'exporter_ip:exporter_port'
    relabel_configs:
      - target_label: script
        replacement: service
配置集成 rancher 中的prometheus operator#
更改对应的
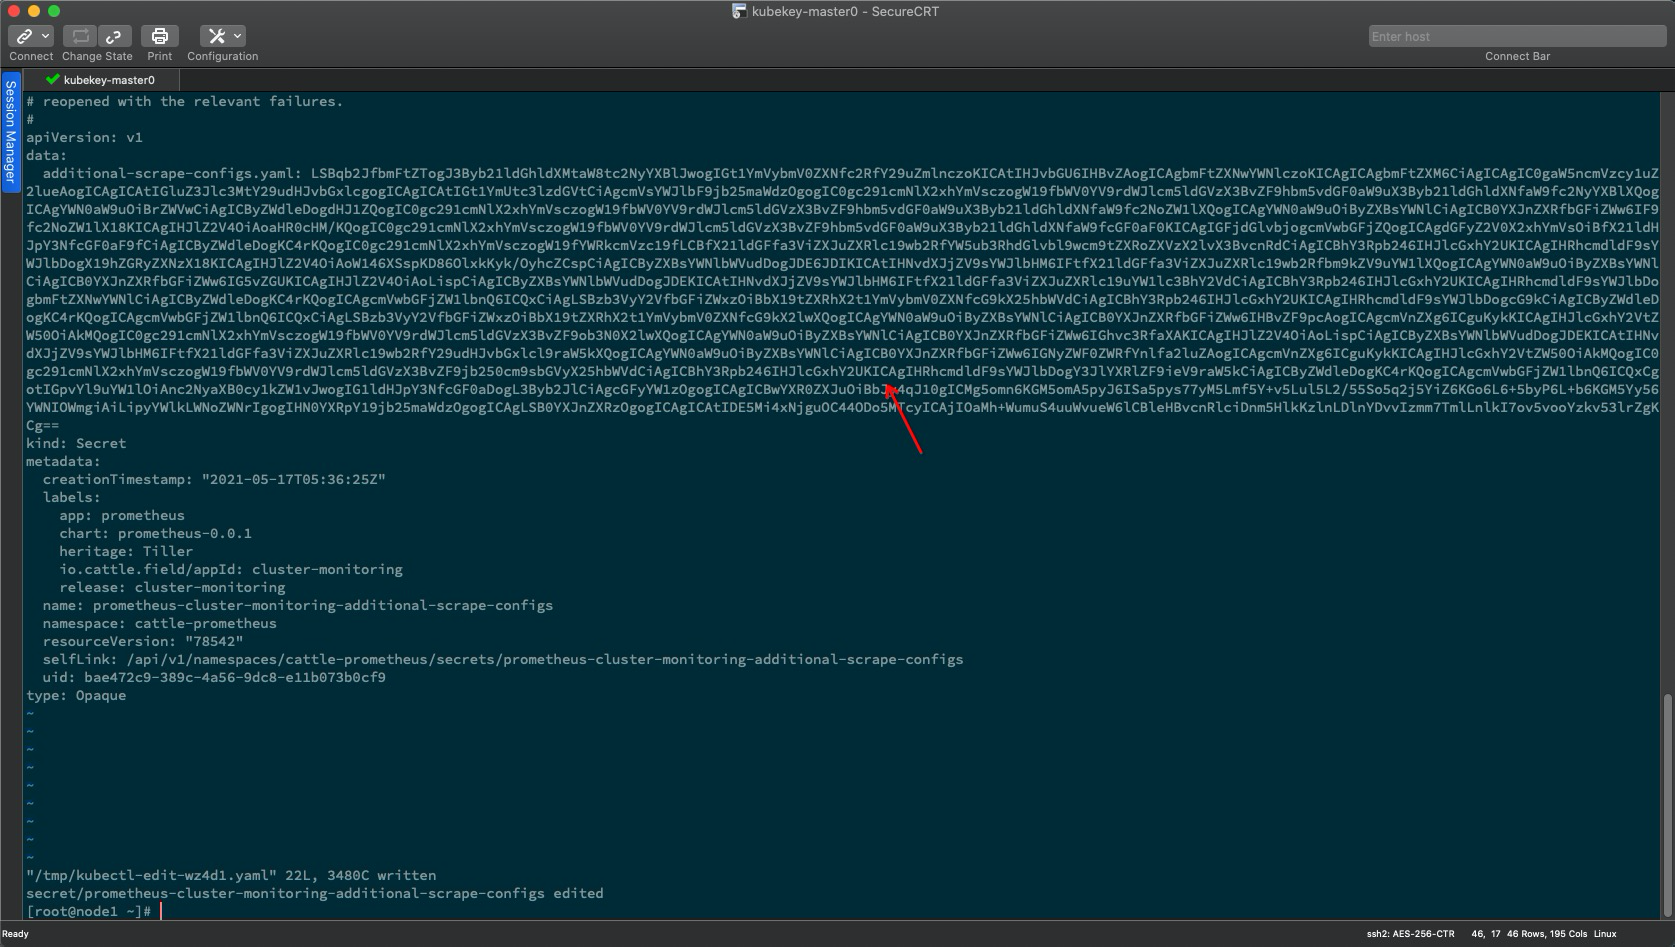
secrets资源对象即可,secrets 资源对象中对配置文件做了一层base64加密
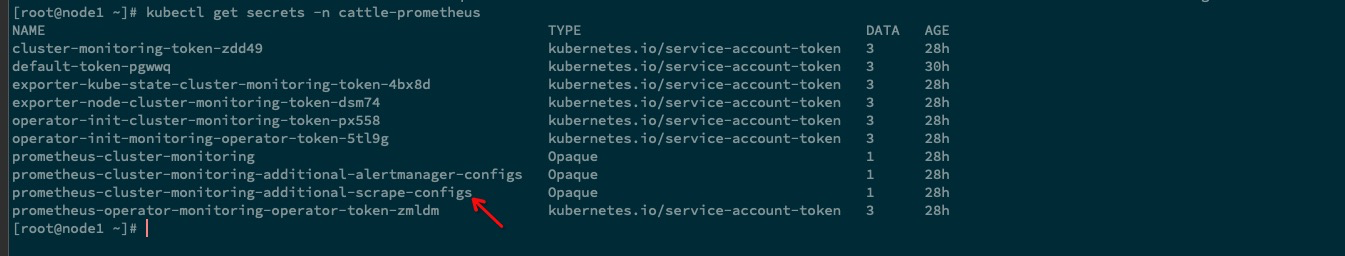
kubectl get secrets prometheus-cluster-monitoring-additional-scrape-configs -n cattle-prometheus -o yaml| awk -F ':' 'NR==3{print $2}'|tr -d ' '|base64 -d
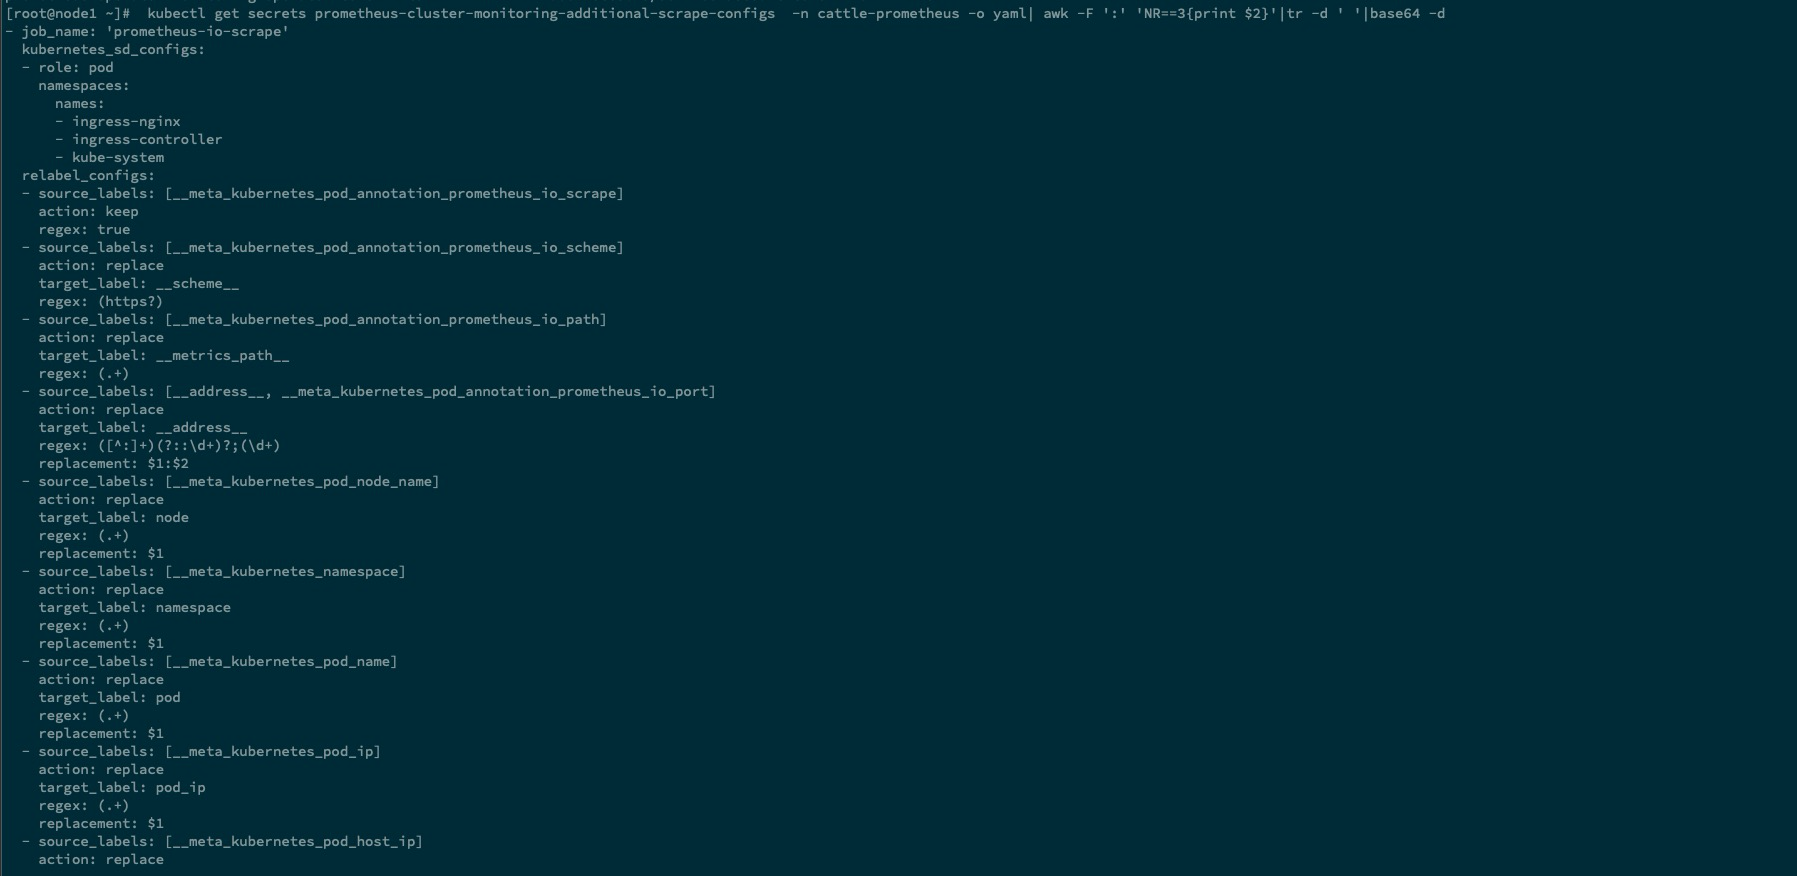
更改 secrets 中配置
kubectl get secrets prometheus-cluster-monitoring-additional-scrape-configs  -n cattle-prometheus -o yaml| awk -F ':' 'NR==3{print $2}'|tr -d ' '|base64 -d > prometheus-cluster-monitoring-additional-scrape-configs.yaml  # 重定向至 文件中方便更改

vim prometheus-cluster-monitoring-additional-scrape-configs.yaml
...
- job_name: 'scripts-demo'
  metrics_path: /probe
  params:
      pattern: ['.*']  # 执行所有脚本,也可以使用正则表达式进行匹配 如 ".*raid-check"
  static_configs:
    - targets:
      - 192.168.8.88:9172  # 指定为对应 exporter 监听地址,更改后进行保存


cat prometheus-cluster-monitoring-additional-scrape-configs.yaml |base64 |tr -d '\n'


kubectl edit secrets prometheus-cluster-monitoring-additional-scrape-configs -n cattle-prometheus  # 将上面的结果输出进行替换

kubectl get secrets prometheus-cluster-monitoring-additional-scrape-configs  -n cattle-prometheus -o yaml| awk -F ':' 'NR==3{print $2}'|tr -d ' '|base64 -d | tail -n 10 # 检查是否生效
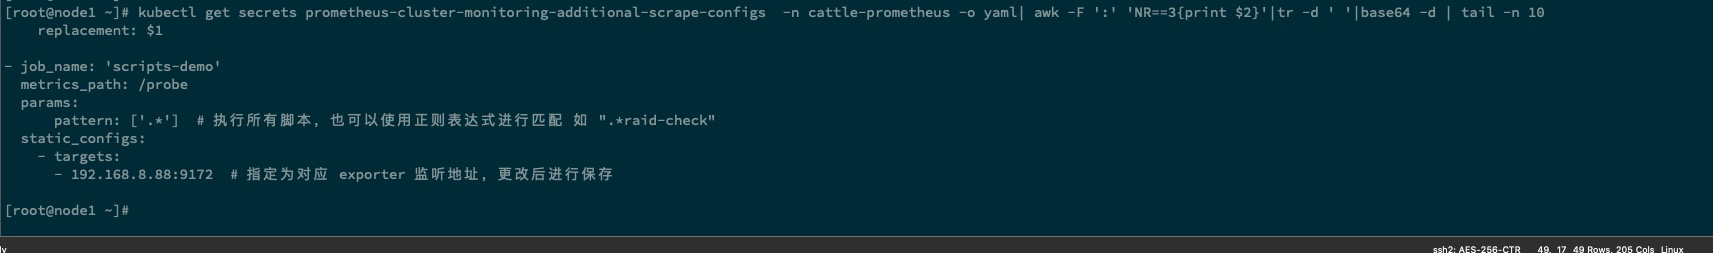
稍等片刻等待配置文件生效
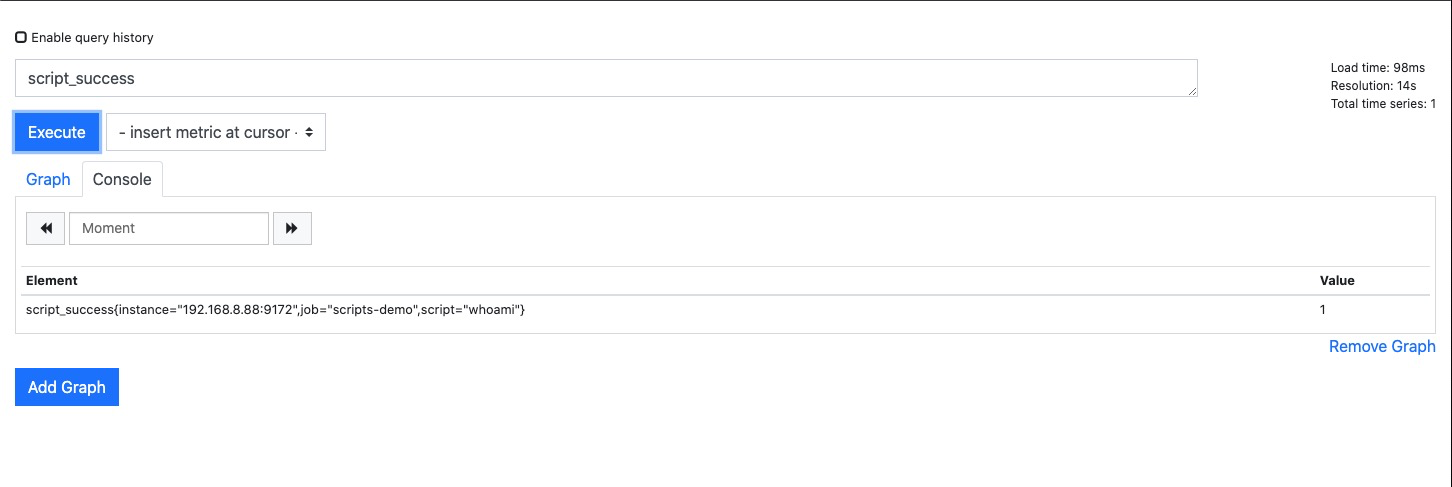
从上述结果展示中,可以看到正常关联上了。
php-fpm_exporter#
此处省略
lnmp环境的安装,网上提供很多一键安装面板,如需实现自行安装配置即可。
配置添加 php 参数#
egrep '/ping|/status' /usr/local/php/etc/php-fpm.d/walle.conf
pm.status_path = /status
ping.path = /ping
添加配置 关联 nginx#
[root@hadoopname ~]# cat /usr/local/nginx/conf/conf.d/
cobra.conf       jumpserver.conf  official.conf    php_status.conf  walle.conf       zabbix.conf
[root@hadoopname ~]# cat /usr/local/nginx/conf/conf.d/php_status.conf
server {
    listen 9010;
    allow 127.0.0.1;
    allow 192.168.8.0/24;
    deny all;

    location ~ ^/(status|ping)$ {
         fastcgi_pass 127.0.0.1:9000;
         fastcgi_param SCRIPT_FILENAME $document_root$fastcgi_script_name;
         include fastcgi_params;
    }
}

nohup php-fpm-exporter --addr 0.0.0.0:9190 --endpoint http://127.0.0.1:9010/status > /tmp/php-fpm-exporter.log 2>&1 &
sudo firewall-cmd --zone=public --add-port=9190/tcp --permanent
firewall-cmd --reload  # 测试启动
配置关联为 systemd 服务,并配置自启#
 cat  > /usr/lib/systemd/system/php-fpm-exporter.service <<EOF
[Unit]
Description=php-fpm-exporter
Documentation=https://github.com/hipages/php-fpm_exporter
After=network.target

[Service]
Type=simple
User=root
ExecStart=/usr/local/bin/php-fpm-exporter --addr 0.0.0.0:9190 --endpoint http://127.0.0.1:9010/status
Restart=on-failure

[Install]
WantedBy=multi-user.target
EOF

systemctl daemon-reload \
&& systemctl start php-fpm-exporter \
&& systemctl status php-fpm-exporter


systemctl enable php-fpm-exporter  # 正常启动后,配置开机自启动
win_exporter#
msiexec /i wmi_exporter-0.7.0-amd64.msi ENABLED_COLLECTORS=cpu,cs,logical_disk,net,os,service,system,textfile,memory,tcp LISTEN_PORT=9010 # 下载软件包后,使用可执行程序注册为服务
blackbox_exporter#
使用 helm 进行安装#
添加配置
chart应用仓库helm repo add prometheus-community https://prometheus-community.github.io/helm-charts helm repo update初始化
values.yaml部署文件helm show values prometheus-community/prometheus-blackbox-exporter > values.yaml # 将默认配置重定向至文件使用 修改精简化处理后的
values.yaml部署cat > values.yaml << EOF config: modules: http_2xx: prober: http timeout: 5s http: basic_auth: username: "admin" # 配置账号密码 防止 http 探针出现 "401" 状态码,导致不通过 password: "admin" http_post_2xx: prober: http timeout: 5s http: method: POST basic_auth: username: "admin" password: "admin" tcp_connect: prober: tcp timeout: 5s pop3s_banner: prober: tcp tcp: query_response: - expect: "^+OK" tls: true tls_config: insecure_skip_verify: false ssh_banner: prober: tcp timeout: 5s tcp: query_response: - expect: "^SSH-2.0-" smtp_starttls: prober: tcp timeout: 5s tcp: query_response: - expect: "^220 " - send: "EHLO prober" - expect: "^250-STARTTLS" - send: "STARTTLS" - expect: "^220" - starttls: true - send: "EHLO prober" - expect: "^250-AUTH" - send: "QUIT" irc_banner: prober: tcp timeout: 5s tcp: query_response: - send: "NICK prober" - send: "USER prober prober prober :prober" - expect: "PING :([^ ]+)" send: "PONG " - expect: "^:[^ ]+ 001" icmp_test: prober: icmp timeout: 5s icmp: preferred_ip_protocol: ip4 dns_test: prober: dns timeout: 5s dns: query_name: "kubernetes.default.svc.cluster.local" preferred_ip_protocol: ip4 ip_protocol_fallback: false validate_answer_rrs: fail_if_matches_regexp: [test] http_header_match_origin: prober: http timeout: 5s http: method: GET headers: Origin: example.com fail_if_header_not_matches: - header: Access-Control-Allow-Origin regexp: '(\*|example\.com)' allow_missing: false allowIcmp: true # 允许使用使用 icmp 协议,默认为 未打开状态 EOF kubectl create ns prometheus helm upgrade --install blackbox -f ./values.yaml prometheus-community/prometheus-blackbox-exporter -n prometheus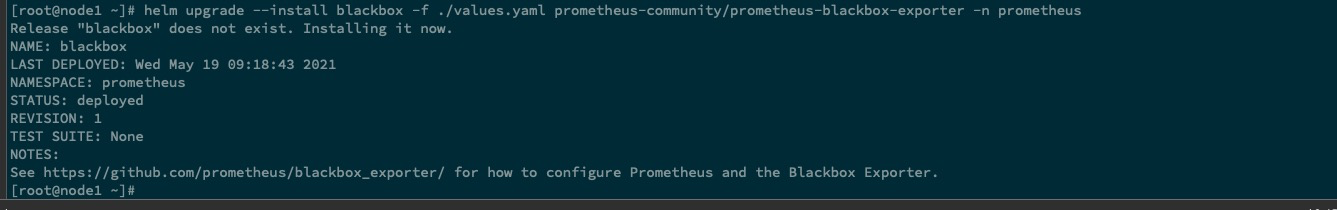
安装后与 prometheus operator 的集成#
同样与上面
scripts exporter关联步骤类似,更改secrets资源对象
重定向至文件中方便进行更改
kubectl get secrets prometheus-cluster-monitoring-additional-scrape-configs -n cattle-prometheus -o yaml| awk -F ':' 'NR==3{print $2}'|tr -d ' '|base64 -d > prometheus-cluster-monitoring-additional-scrape-configs.yaml在重定向生成的文件中追加配置
cat prometheus-cluster-monitoring-additional-scrape-configs.yaml
....
- job_name: 'http-blackbox'
  metrics_path: /probe
  params:
    module: [http_2xx]  #使用 http 模块
  static_configs:
    - targets:
      - 192.168.8.1
      labels:  # 配置标签
        group: http
        net: local
    - targets:
      - www.baidu.com
      labels:
        group: http
        net: public
  relabel_configs:
  - source_labels: [__address__]
    target_label: __param_target
  - source_labels: [__param_target]
    target_label: instance
  - target_label: __address__
    replacement: blackbox-prometheus-blackbox-exporter.prometheus:9115  # 使用 k8s 内部域名进行通讯

- job_name: 'icmp-ping'
  metrics_path: /probe
  params:
    module: [icmp_test]
  static_configs:
    - targets:
      - 192.168.8.1
      labels:
        dc: 'ancun-local'
        group: 'icmp'
        instance: 'icmp-status'
  relabel_configs:
  - source_labels: [__address__]
    regex: (.*)(:80)?
    target_label: __param_target
    replacement: ${1}
  - source_labels: [__param_target]
    target_label: instance
  - source_labels: [__param_target]
    regex: (.*)
    target_label: ping
    replacement: ${1}
  - source_labels: []
    regex: .*
    target_label: __address__
    replacement: blackbox-prometheus-blackbox-exporter.prometheus:9115

- job_name: 'tcp-port-status'
  metrics_path: /probe
  params:
    module: [tcp_connect]
  static_configs:
    - targets:
      - 192.168.8.1:80
      - 192.168.8.1:9000
      labels:
        group: tcp
        net: 'local'
        type: nginx
    - targets:
      - 192.168.1.31:32379
      labels:
        group: tcp
        net: 'local'
        type: 'redis'
    - targets:
      - 192.168.1.50:3306
      - 192.168.1.51:3306
      - 192.168.1.33:3306
      - 192.168.1.232:3306
      labels:
        group: tcp
        net: 'local'
        type: 'mysql'
  relabel_configs:
  - source_labels: [__address__]
    target_label: __param_target
  - source_labels: [__address__]
    regex: (.*):(.*)
    target_label: host_ip
    replacement: $1
  - source_labels: [__address__]
    regex: (.*):(.*)
    target_label: host_port
    replacement: $2
  - target_label: __address__
    replacement: blackbox-prometheus-blackbox-exporter.prometheus:9115


cat prometheus-cluster-monitoring-additional-scrape-configs.yaml |base64 |tr -d '\n' # 对配置文件进行 base 转码
进行
secrets资源对象的更改cat prometheus-cluster-monitoring-additional-scrape-configs.yaml |base64 |tr -d '\n' # 对配置文件进行 base 转码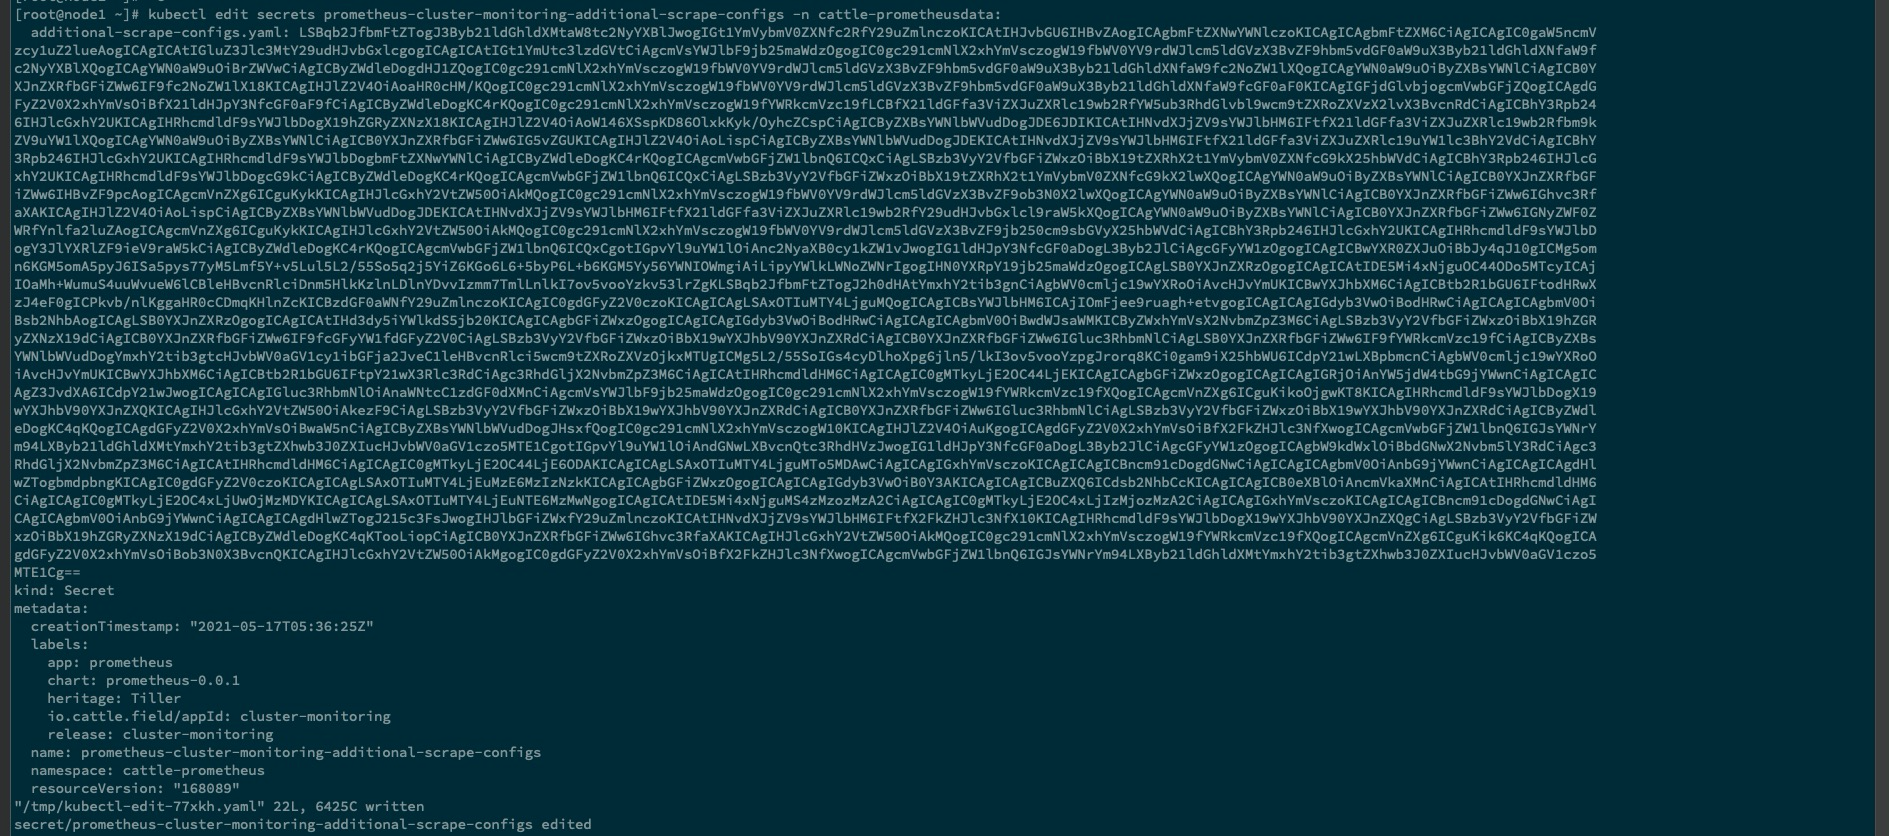
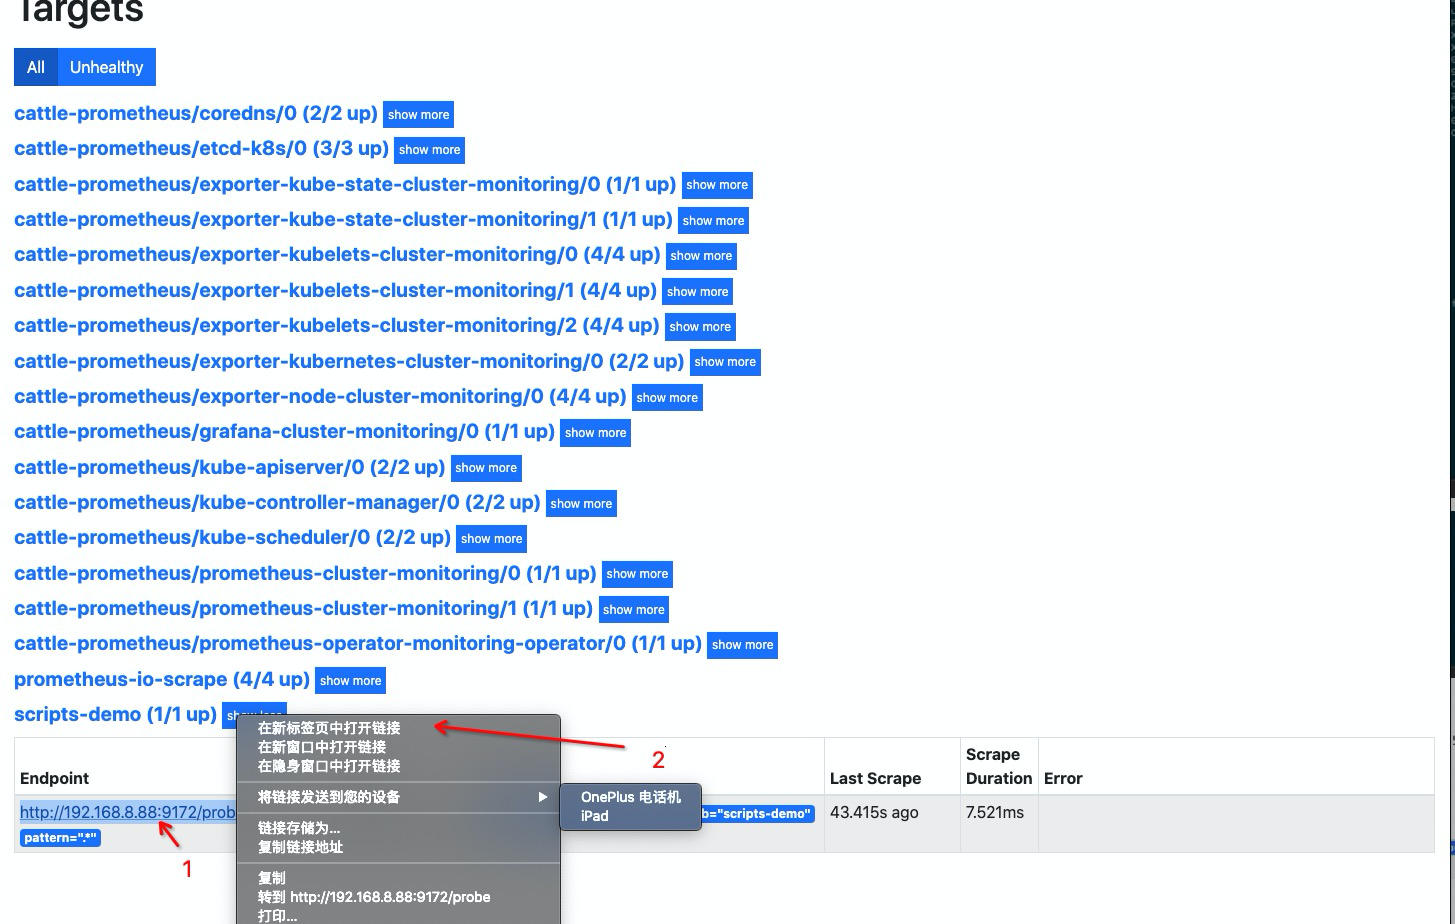
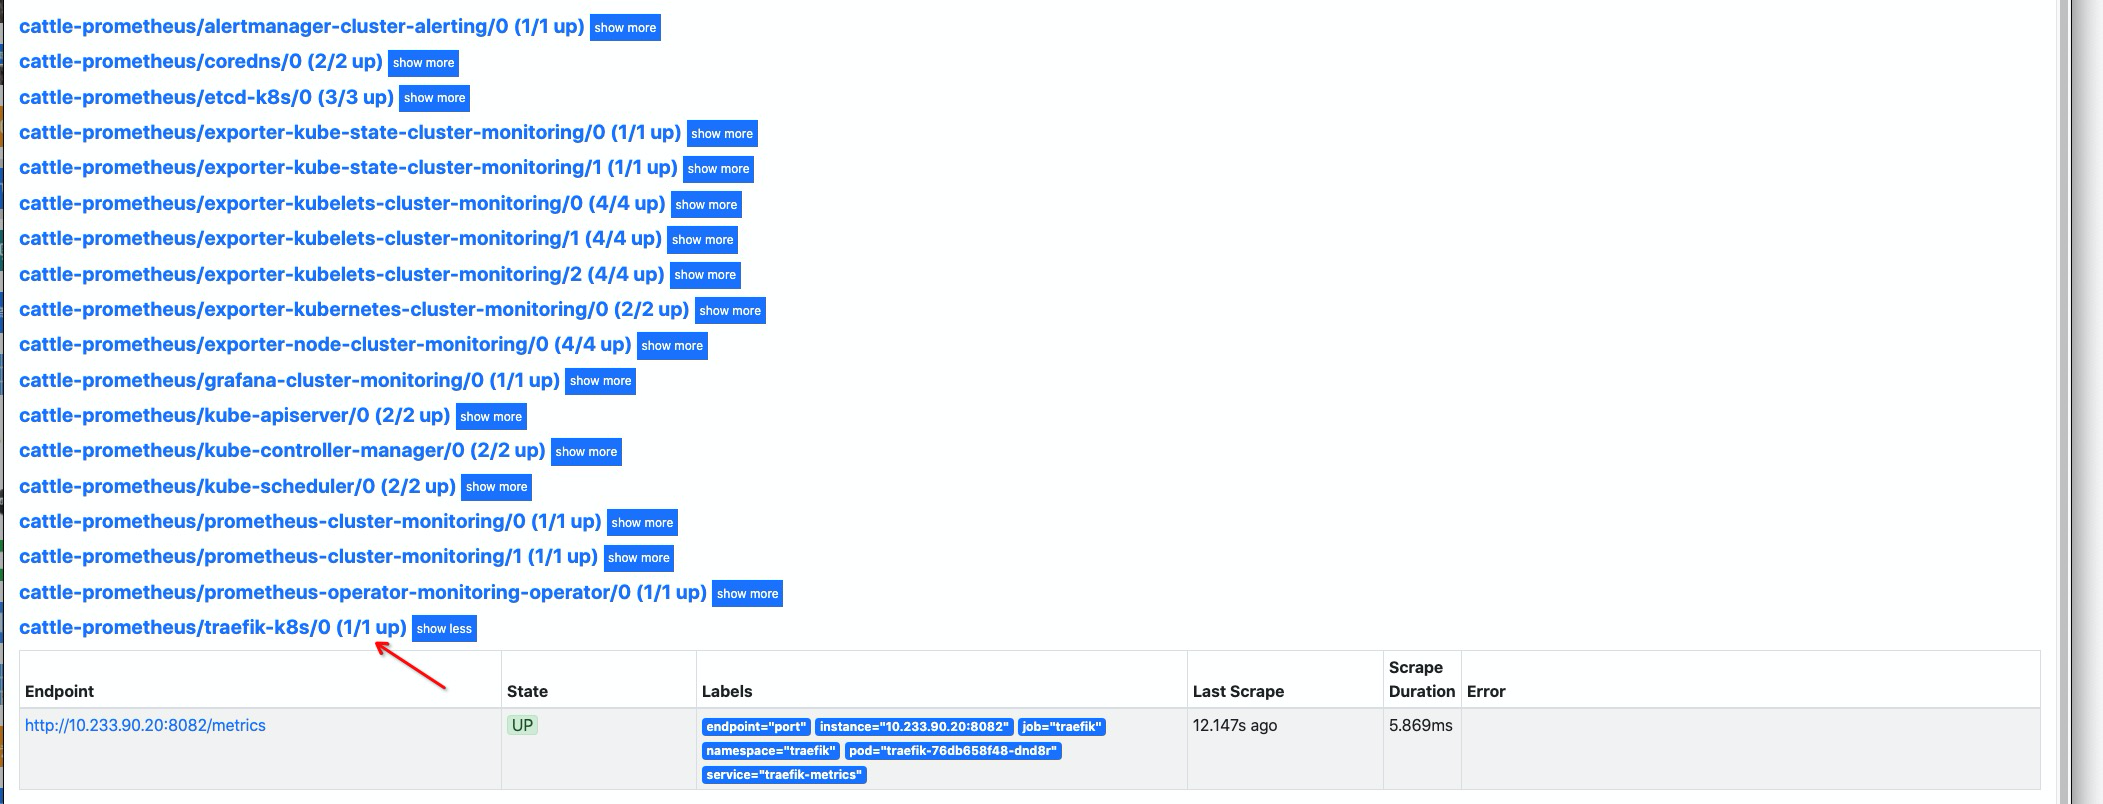
检查 prometheus operator 配置是否有更新#
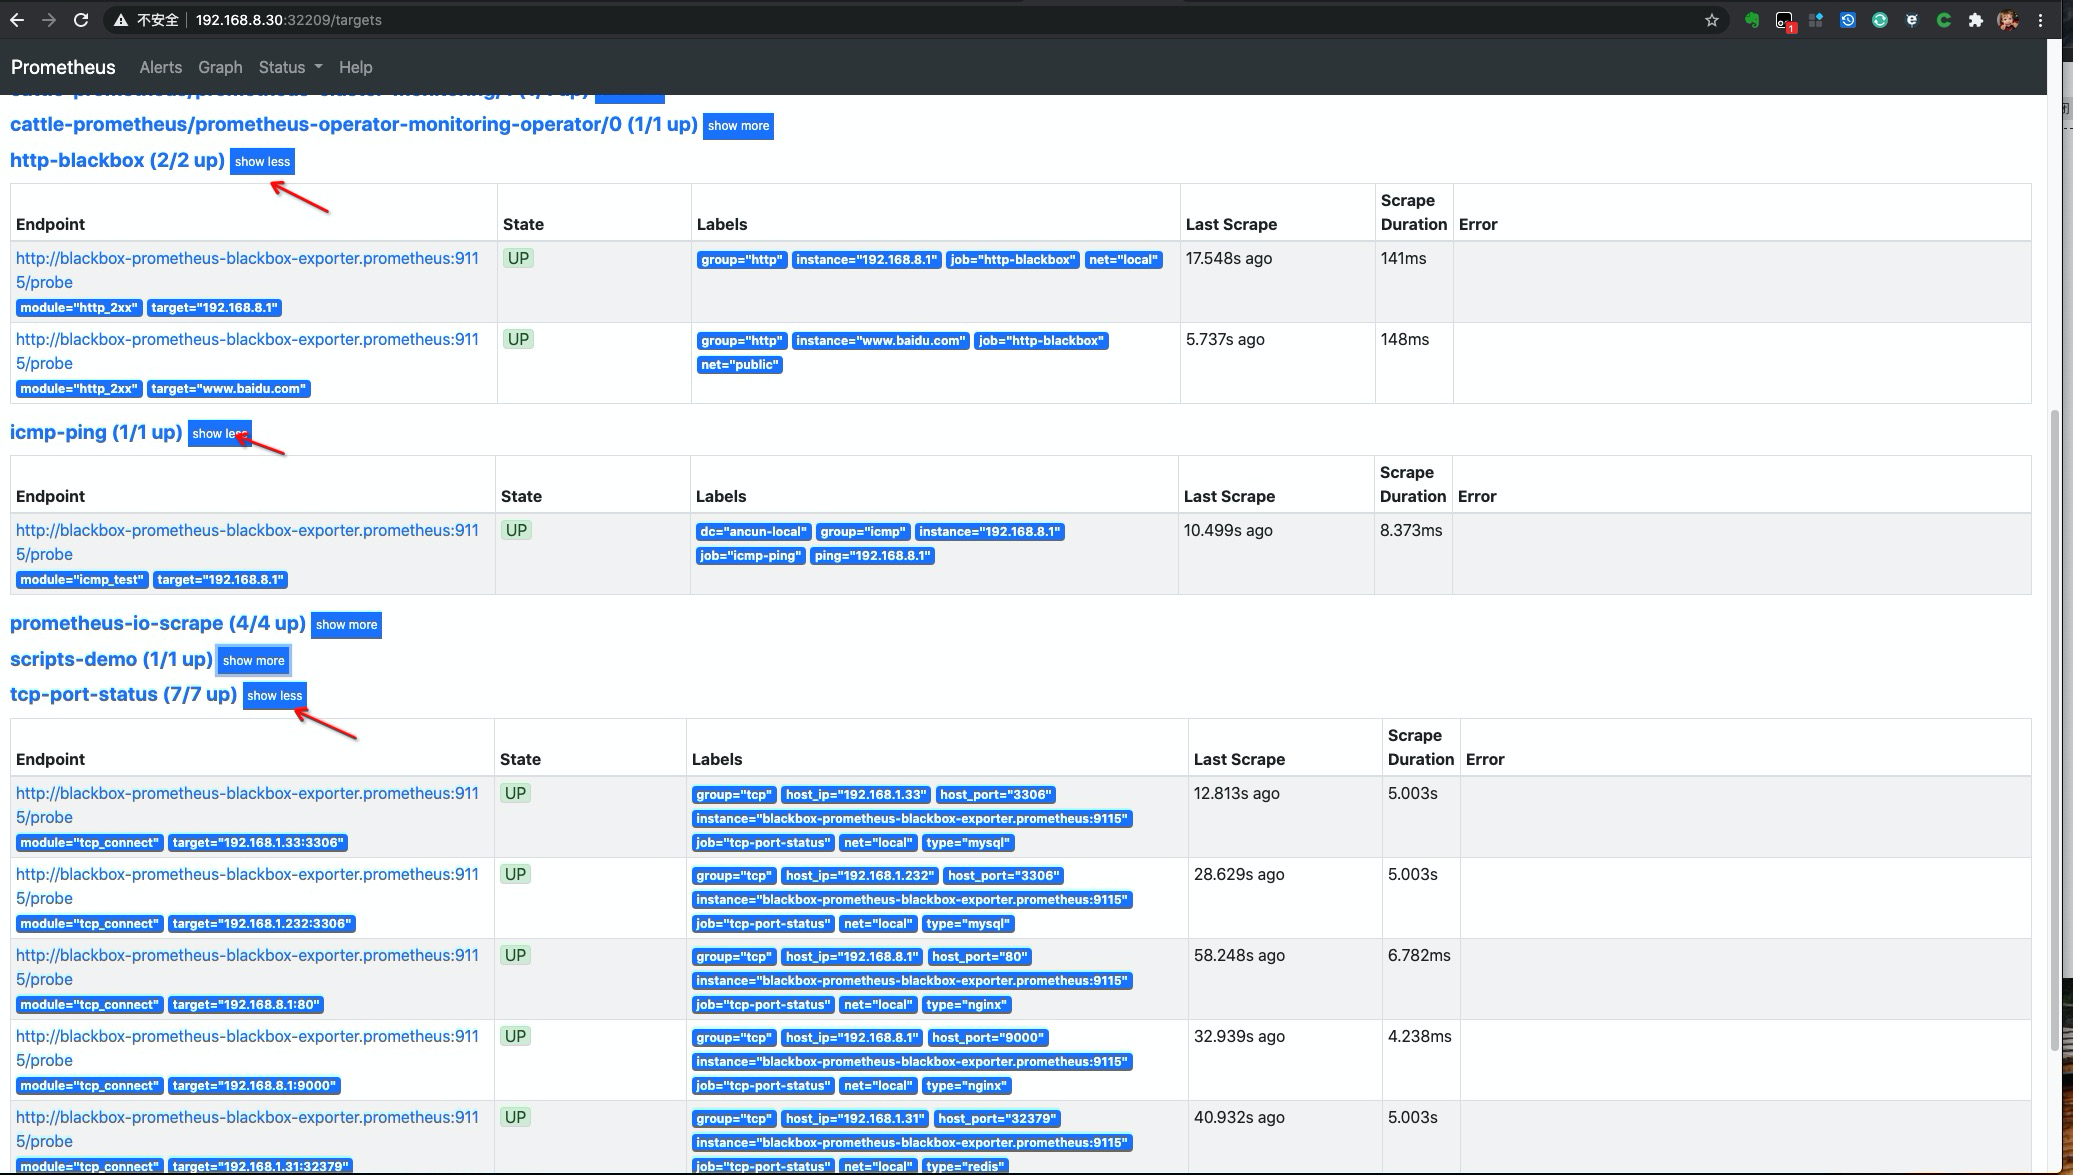
可以看到所添加的配置项已 在 dashboard 页面有所展示了
我们在 查询页面输入 probe_success 看看探针执行情况
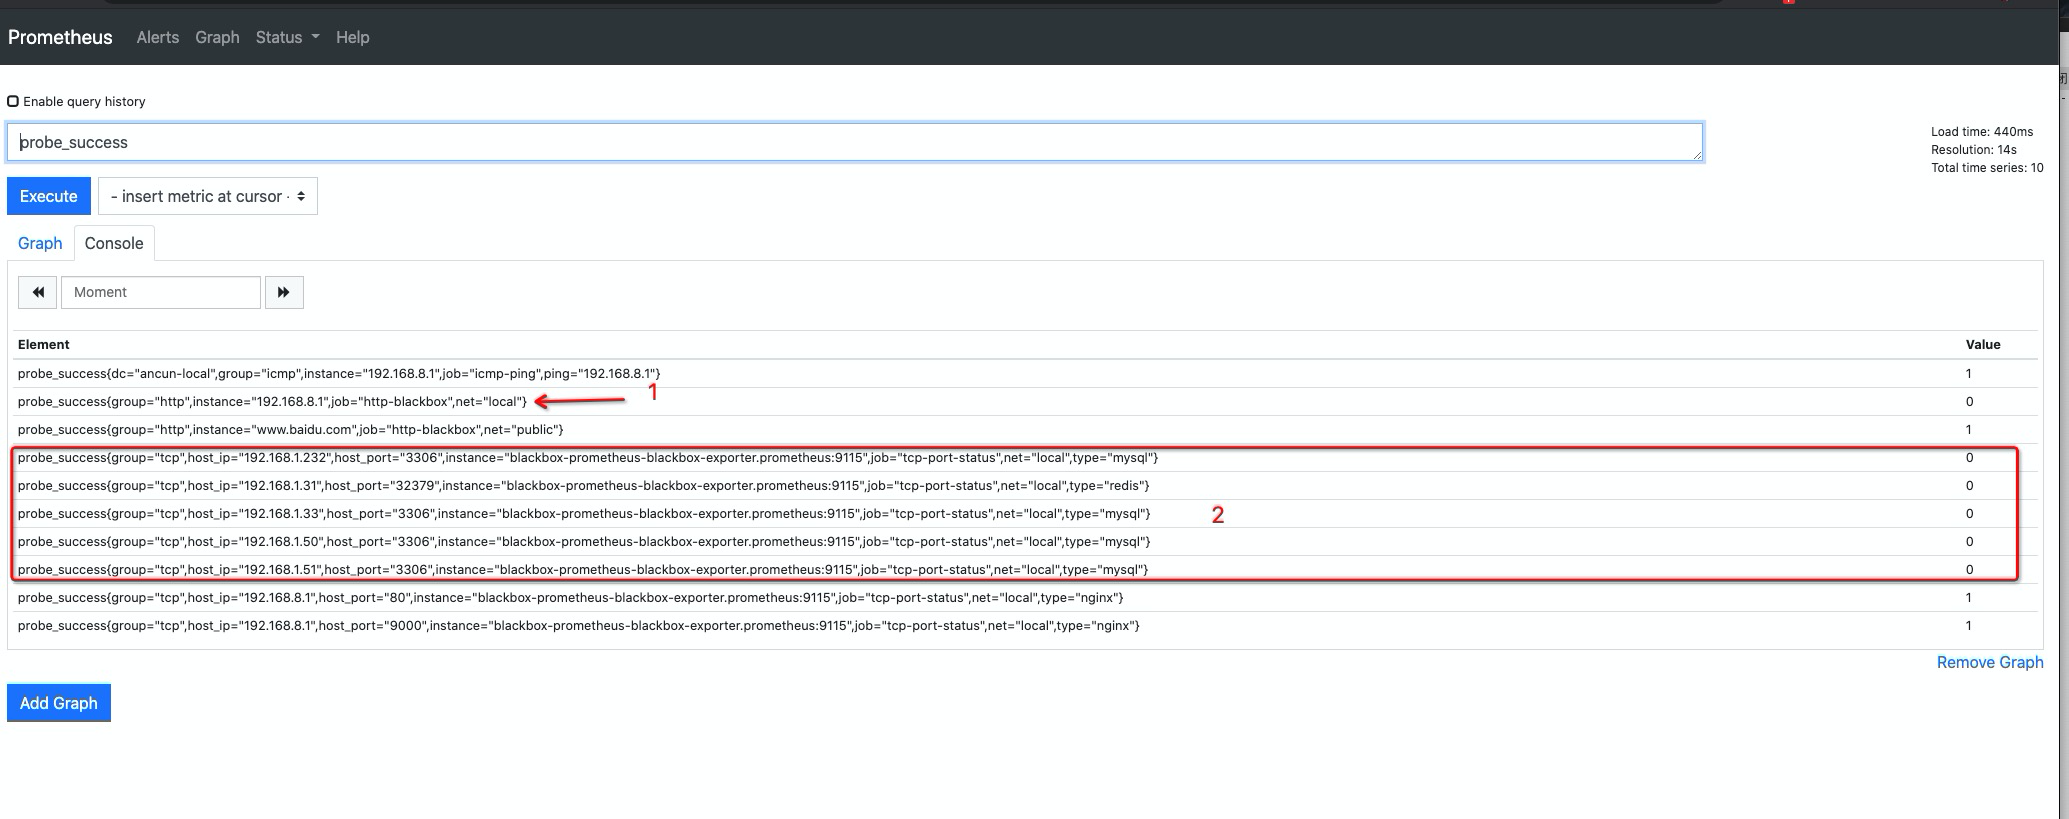
可以看到可以正常看到探针检查情况,标注的两处探针检查未通过说明:
1位置,检查未通过是因为 blackbox 配置的basic_auth认证密钥不匹配导致,2位置为 无法访问的局域网,属于正常情况。
traefik metrcis 关联#
省略 traefik 的安装部署操作,详情请参考较 早期文档。需要确认配置已将
metrcis指标已打开,下面演示使用helm部署的 traefik 为其添加暴露metrics指标操作。
helm 安装 traefik,并配置开启 metrcis#
git clone https://github.com/traefik/traefik-helm-chart

cd traefik-helm-chart

cat > prod-values.yaml << EOF
ingressRoute:
  dashboard:
    enabled: false  # 关闭渲染 dashboard,改用手动创建

# Configure ports
ports:
  web:
    port: 8000
    hostPort: 80  # 使用 hostport 模式
  websecure:
    port: 8443
    hostPort: 443  # 使用 hostport 模式

service:
  enabled: false  # 改用 hostpath 模式后,service 渲染可取消

logs:
  general:
    level: ERROR # 设置日志级别,建议

tolerations:
- key: "node-role.kubernetes.io/master"
  operator: "Equal"
  effect: "NoSchedule"  # 容忍污点

nodeSelector:   # 节点亲和,固定到标签 master01 节点上
  kubernetes.io/hostname: "node1"

additionalArguments:  # 添加额外暴露 指标的参数
- --entryPoints.metrics.address=:8082
- --metrics.prometheus.entryPoint=metrics
EOF

kubectl create ns traefik

helm upgrade --install traefik -n traefik -f ./prod-values.yaml ./traefik/

kubectl get po -n traefik -o wide|awk 'NR==2{print $6}'|xargs -t -I{} curl http://{}:8082/metrics # 测试是否有指标暴露

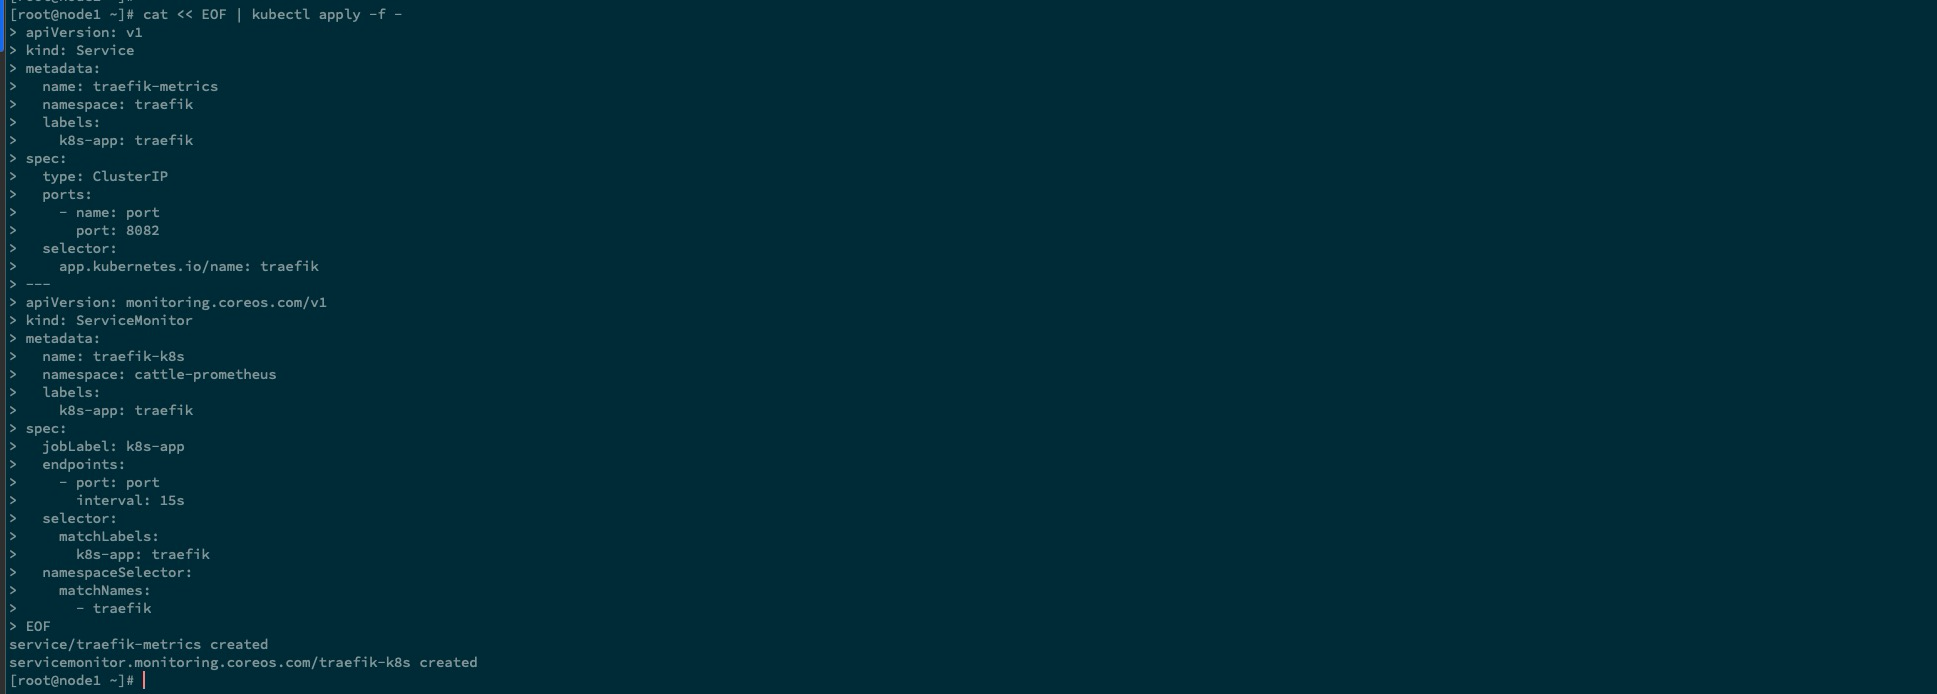
创建 serviceMinitor 资源配置关联 operator#
cat << EOF | kubectl apply -f -
apiVersion: v1
kind: Service
metadata:
  name: traefik-metrics
  namespace: traefik
  labels:
    k8s-app: traefik
spec:
  type: ClusterIP
  ports:
    - name: port
      port: 8082
  selector:
    app.kubernetes.io/name: traefik
---
apiVersion: monitoring.coreos.com/v1
kind: ServiceMonitor
metadata:
  name: traefik-k8s
  namespace: cattle-prometheus
  labels:
    k8s-app: traefik
spec:
  jobLabel: k8s-app
  endpoints:
    - port: port
      interval: 15s
  selector:
    matchLabels:
      k8s-app: traefik
  namespaceSelector:
    matchNames:
      - traefik
EOF
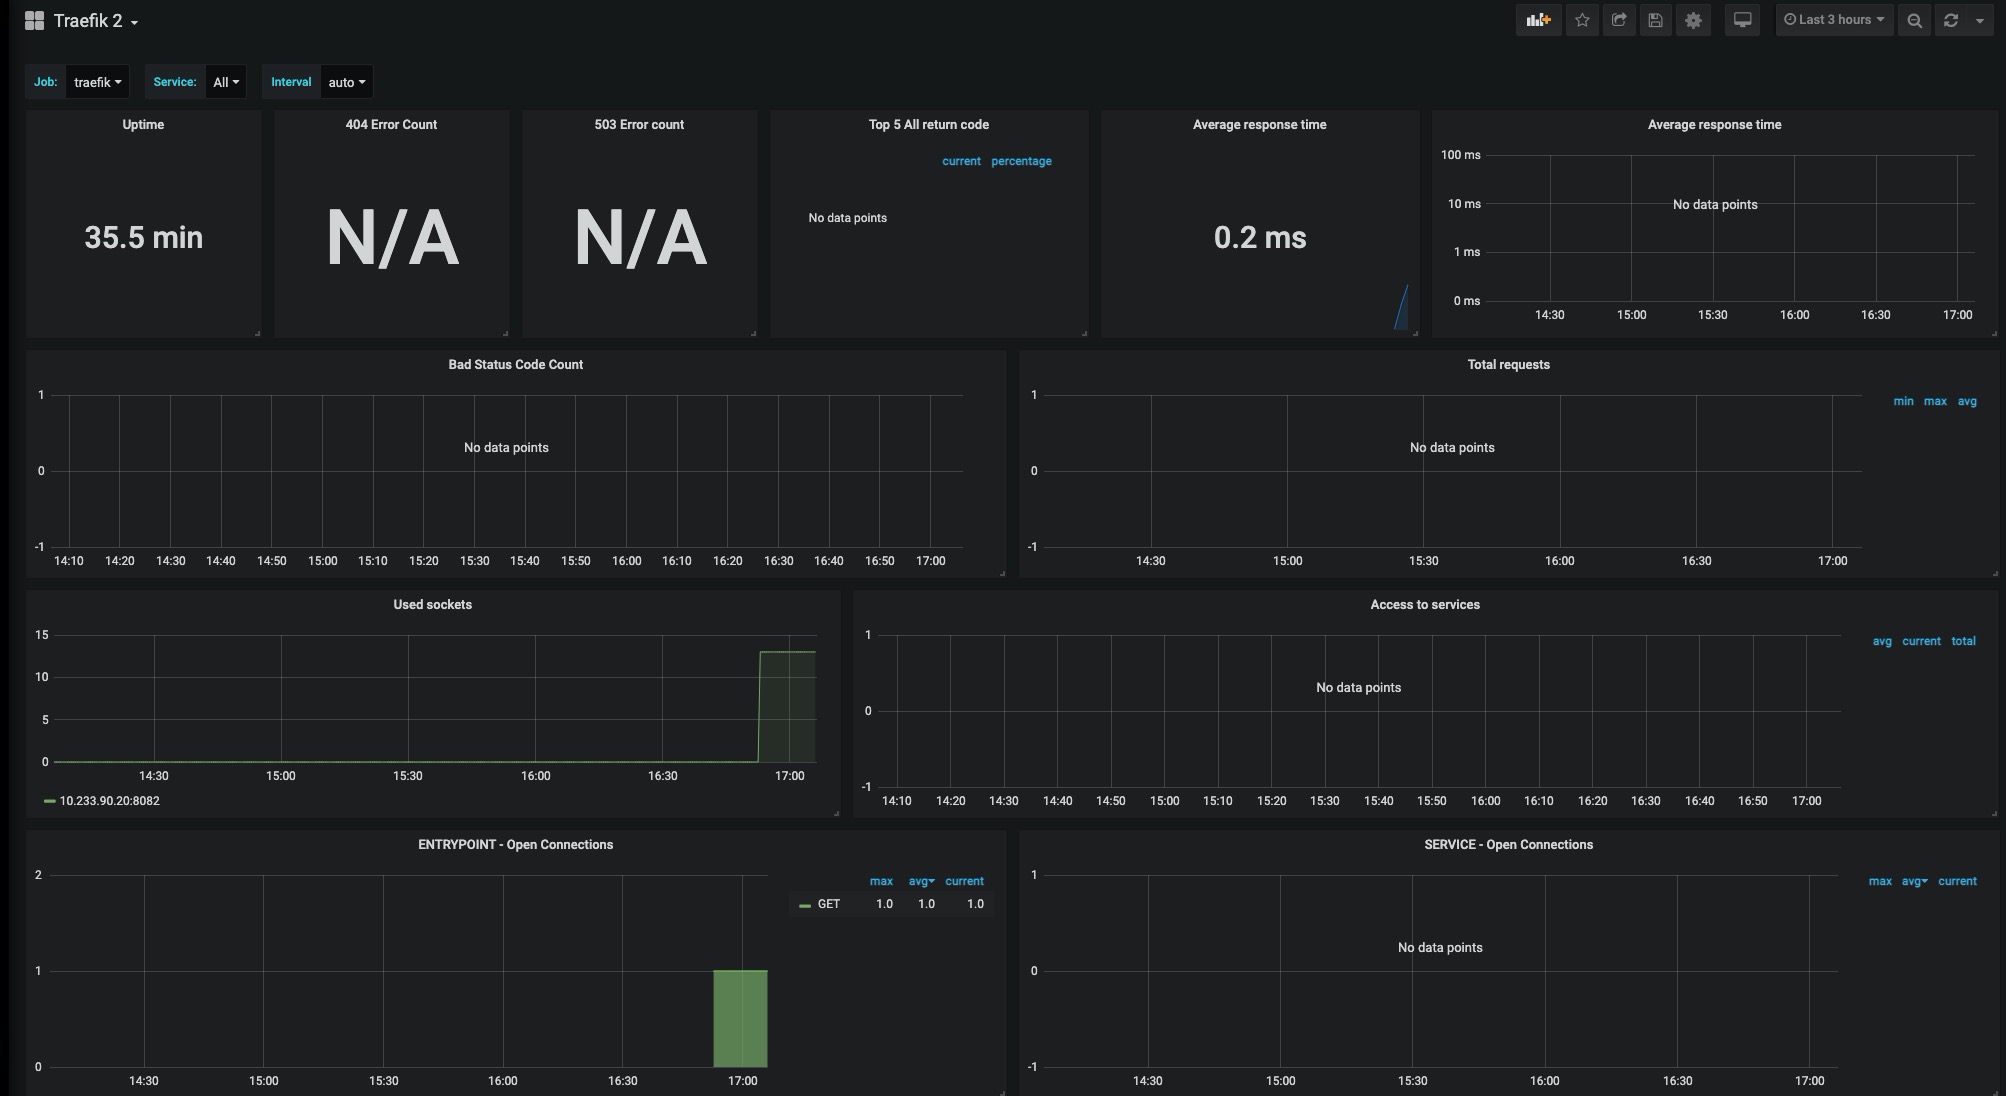
配置 grafana dashboard#
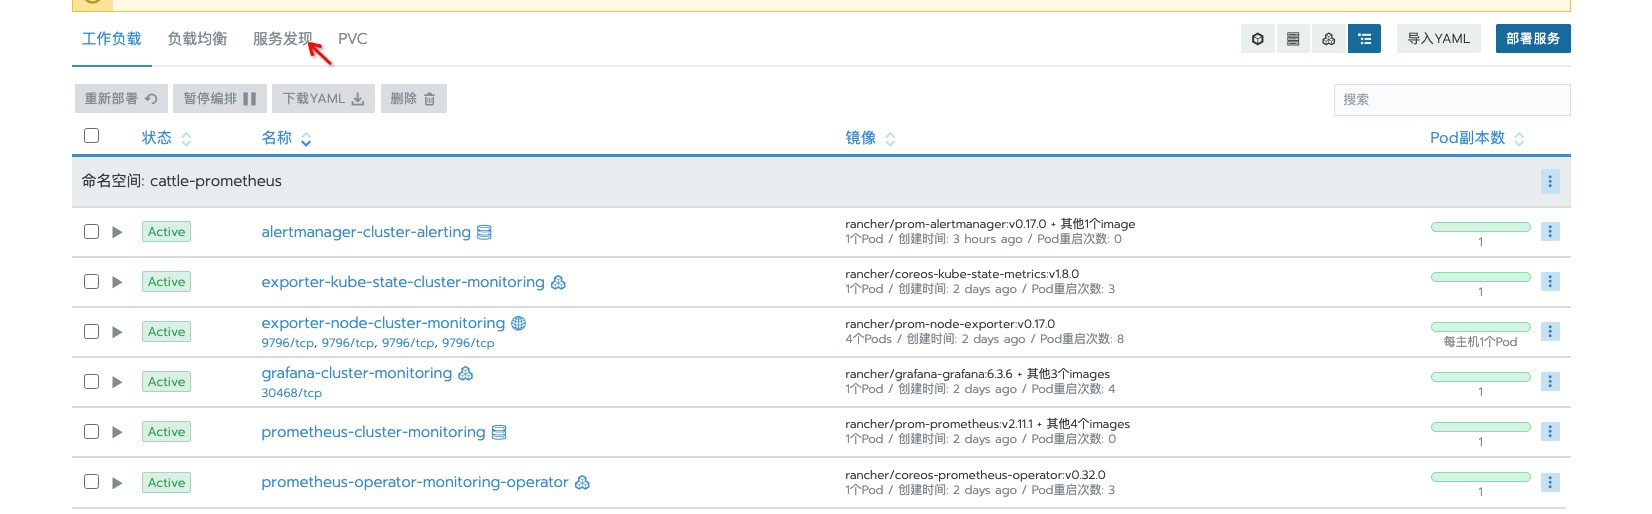
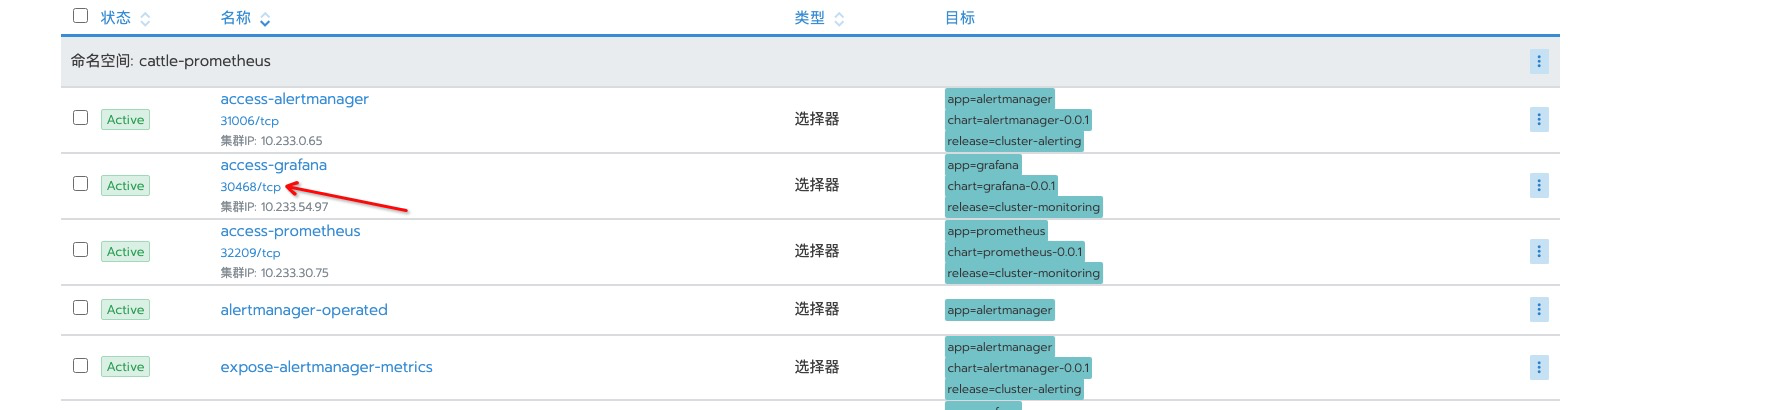
进入system 项目下,点击 服务发现, 点击访问 grafana 的 nodePort 地址
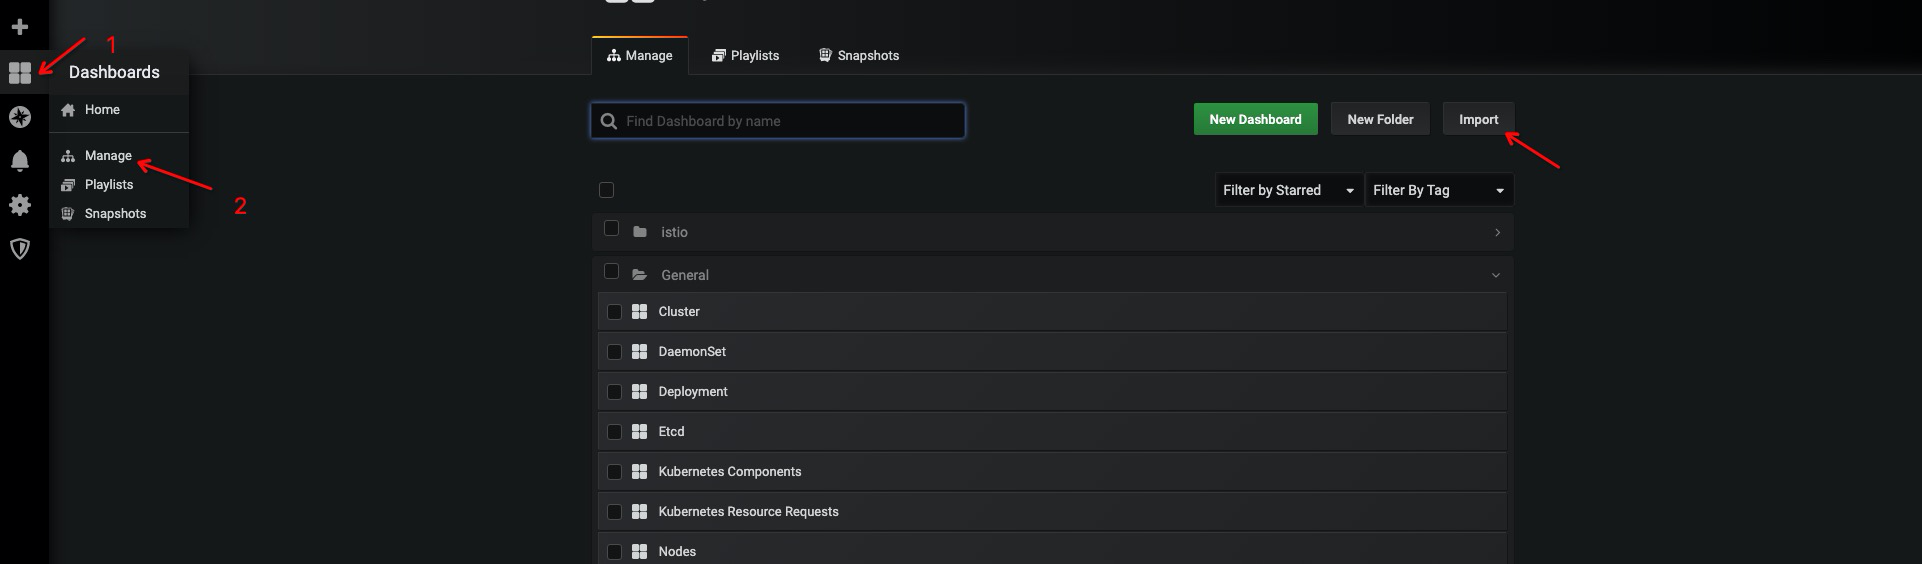
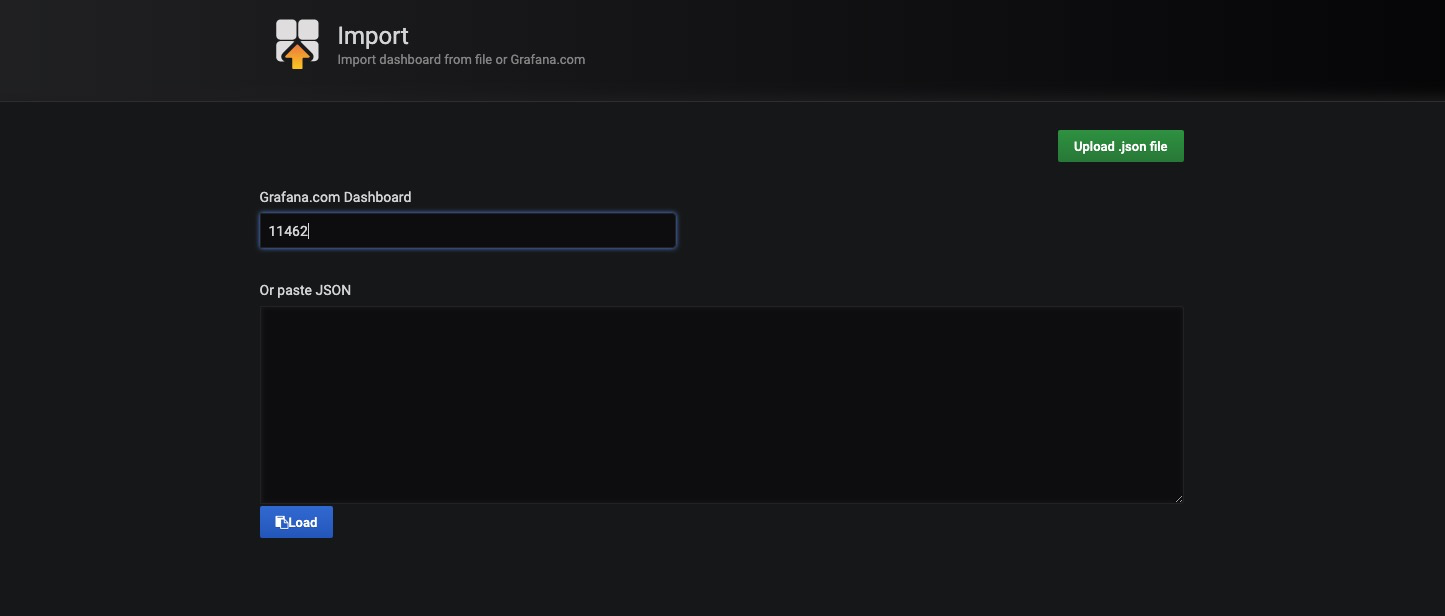
点击导入 ID为
11462的 traefik dashboard,官方社区提供的dashboard搜索地址
如提示插件未安装情况,进入对应容器使用下面命令进行安装即可。
grafana-cli plugins install xxxx
总结#
此篇文档主要介绍了外部 exporter 与 rancher 中
monitor的配置关联工作的另外一种方法,那就是直接更改secret资源对象。对比使用 前面 的使用创建的serviceMonitor资源对象,此方法相较于没有那么优雅,为保证prometheus operator使用理念,如果不是像scripts exporter&blackbox exporter这种配置比较繁琐麻烦的使用serviceMonitor关联难管理的 ,还是偏向建议于使用serviceMonitor资源对象进行配置关联。