- 博客/
Rancher 开启监控,及生产应用的优化配置工作说明 (一)
Table of Contents
环境说明#
- kubernetes version:
v1.17.9 - rancher dashboard:
v2.3.5 - 操作系统:
centos 7.8.2003
基础环境配置#
使用 kubekey 部署 kubernetes 集群#
由于篇幅原因,此处省略部署说明,请参考较早期的 文档说明
rancher 单机部署#
安装 docker-compose
yum install -y docker-compose
创建 workspace 目录
mkdir -p /data/docker-compose/rancher
创建配置文件 & 启动容器
cd /data/docker-compose/rancher

cat > docker-compose.yaml << EOF
version: "3"
services:
  rancher:
    container_name: rancher
    image: rancher/rancher:v2.3.5 # 这里注意一下版本,请使用 2.0.x - 2.4.x 的版本,因为在 2.5 版本后之后的版本,对 dashboard 界面和管理方式做了大幅修改。
    volumes:
      - /var/lib/rancher:/var/lib/rancher  # rancher 数据持久化
    ports:
      - "80:80/tcp"
      - "443:443/tcp"
    privileged: true
    restart: unless-stopped
EOF

docker-compose up -d # 启动对应容器

docker-compose logs -f  # 启动后观察 一下启动日志,有无错误信息
省略rancher 导入集群操作,请参考较之前的 文档
安装 nfs classStorage#
此处同样省略,请参照早期 文档
开启监控#
首先为集群开启监控#
rancher 需要开启
系统层面的监控,才能逐个打开项目级别的监控。
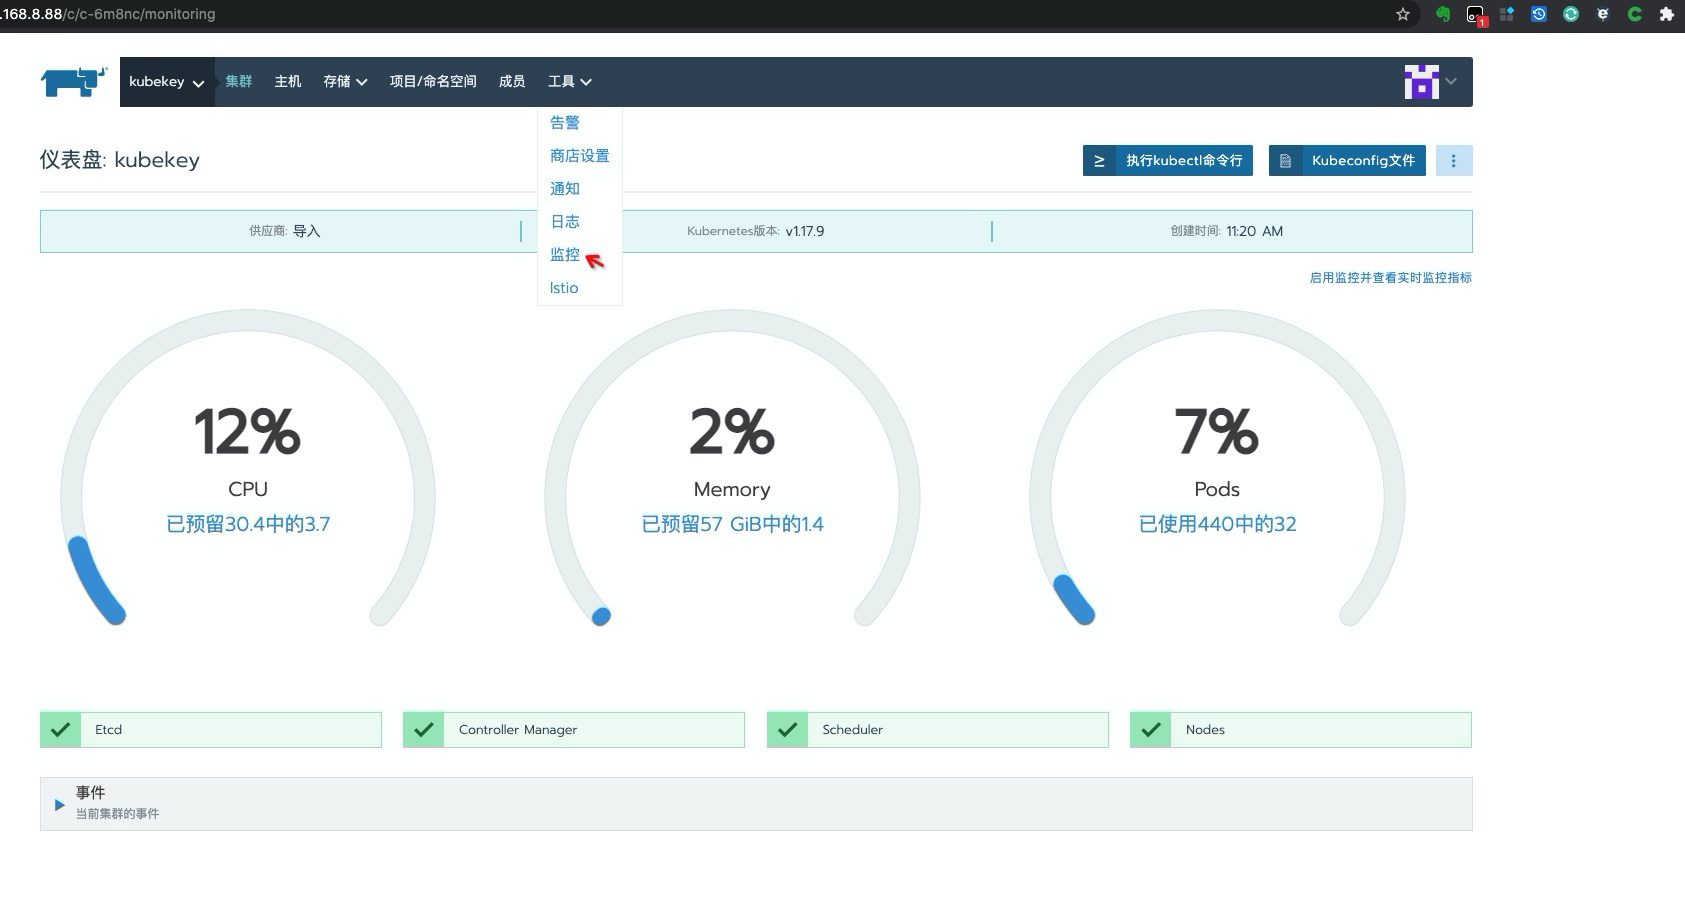
开启系统层面的监控
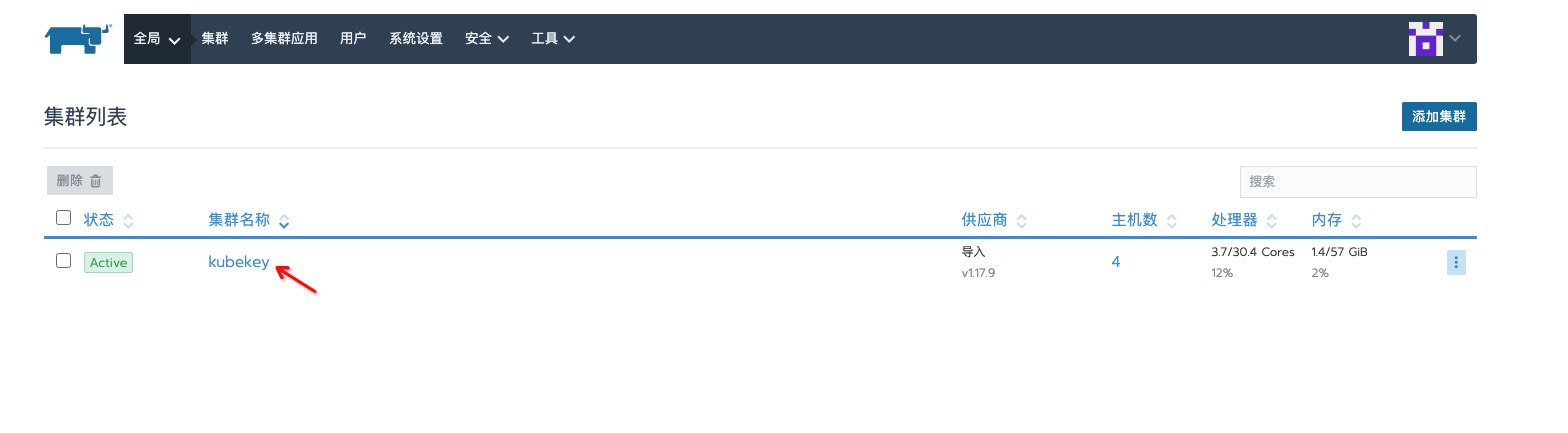
点击选择的集群
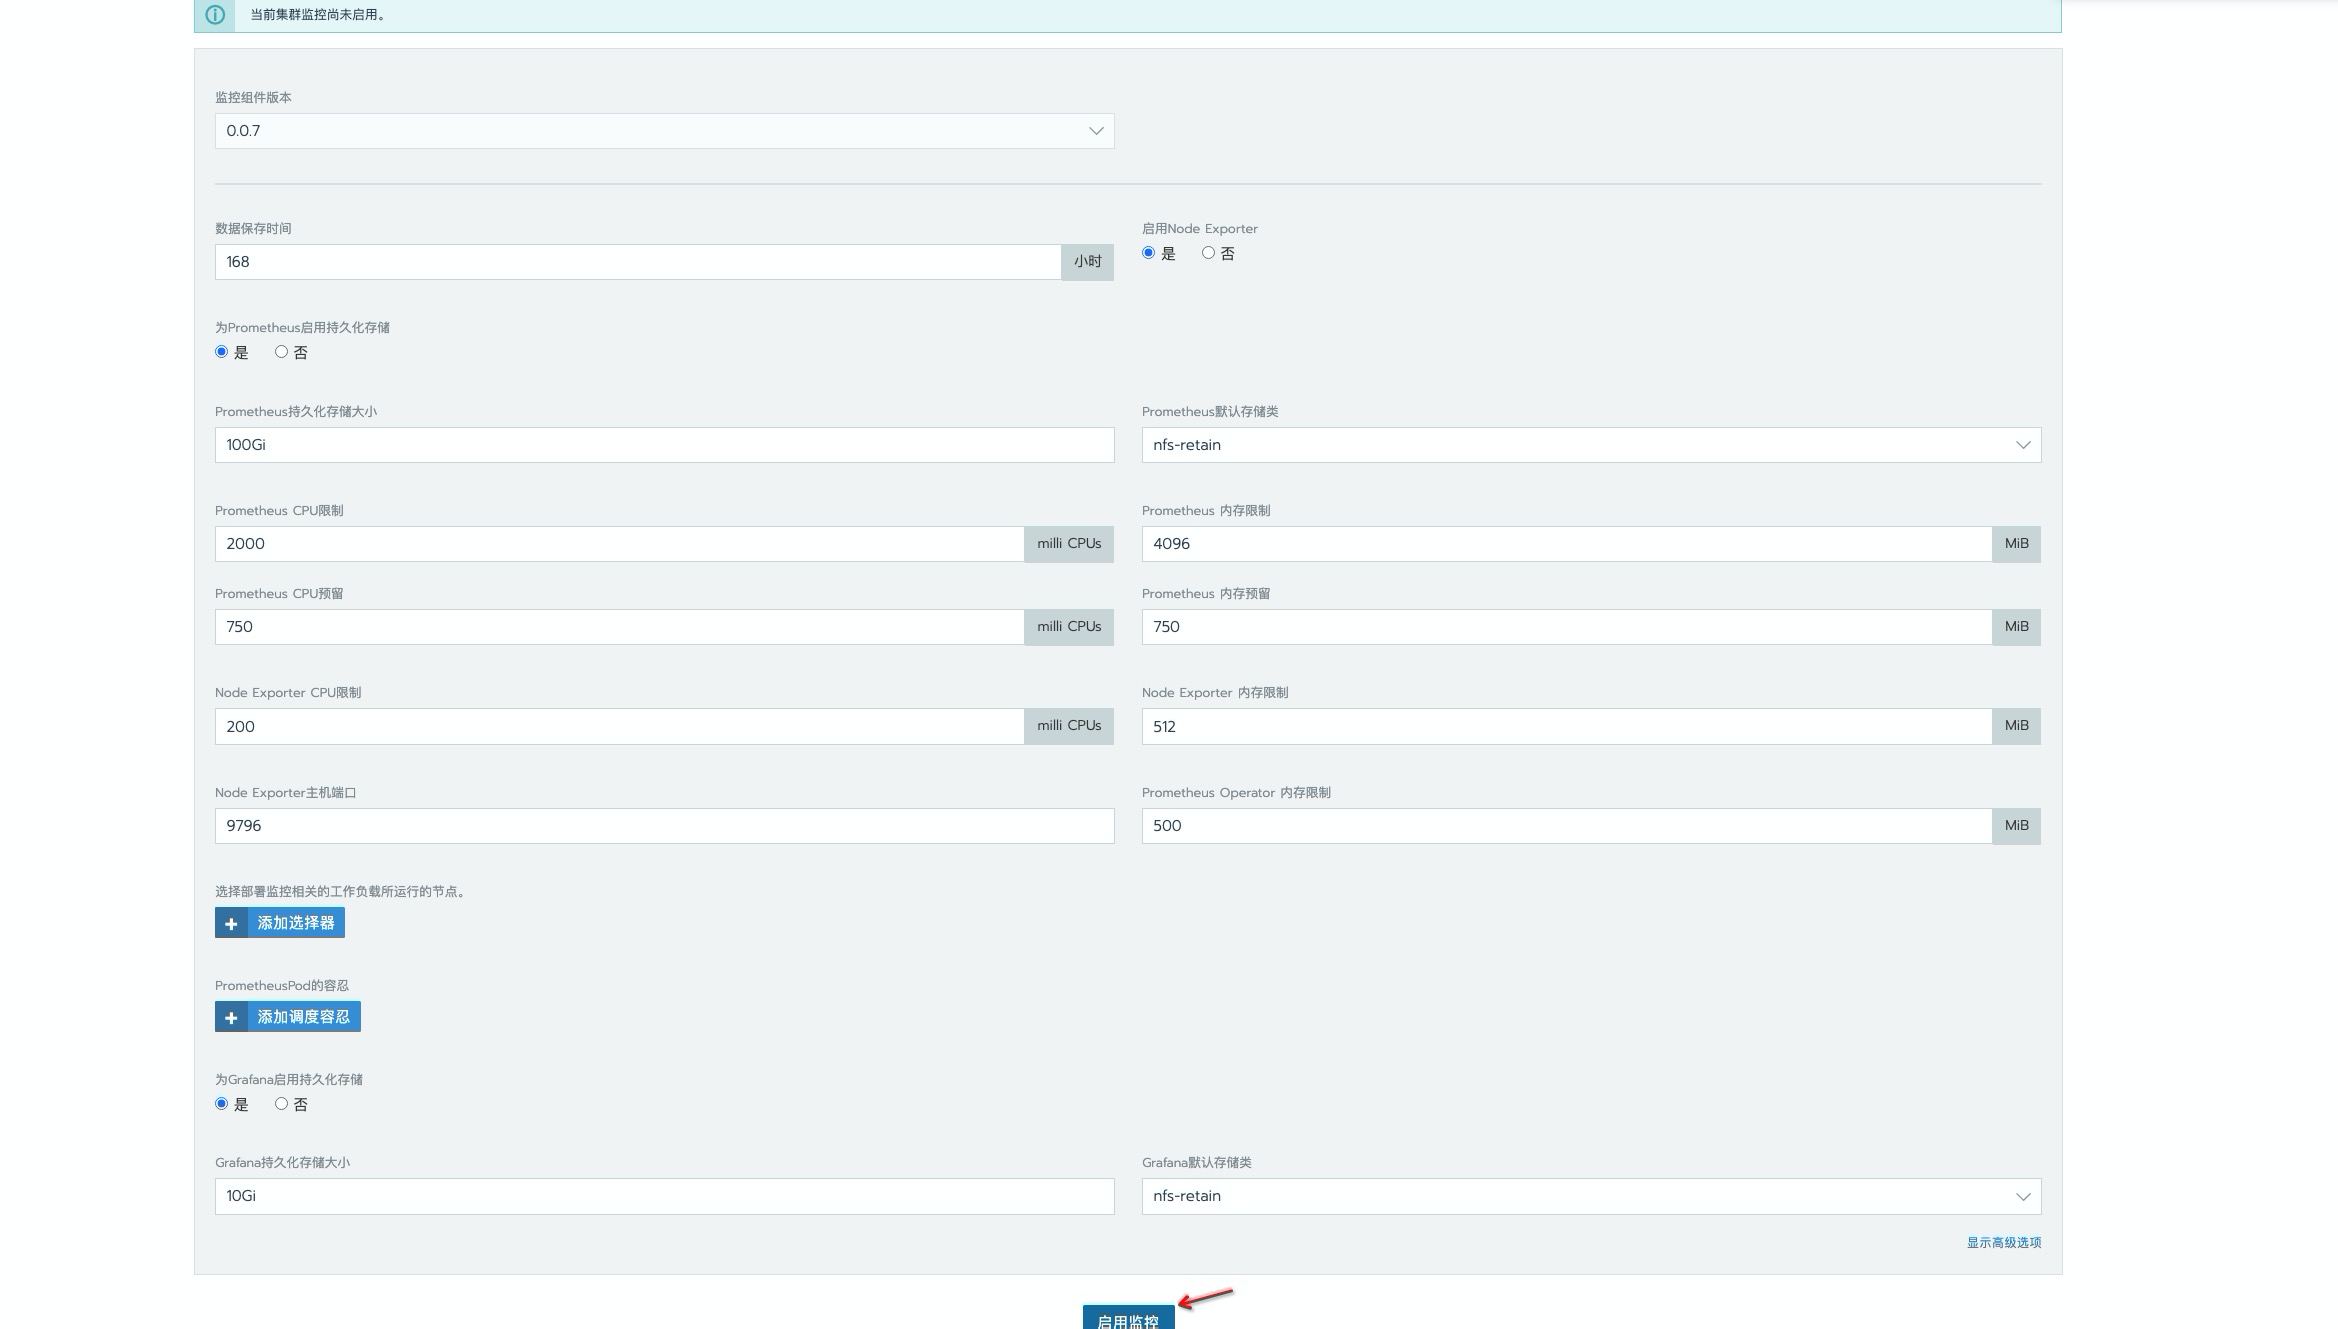
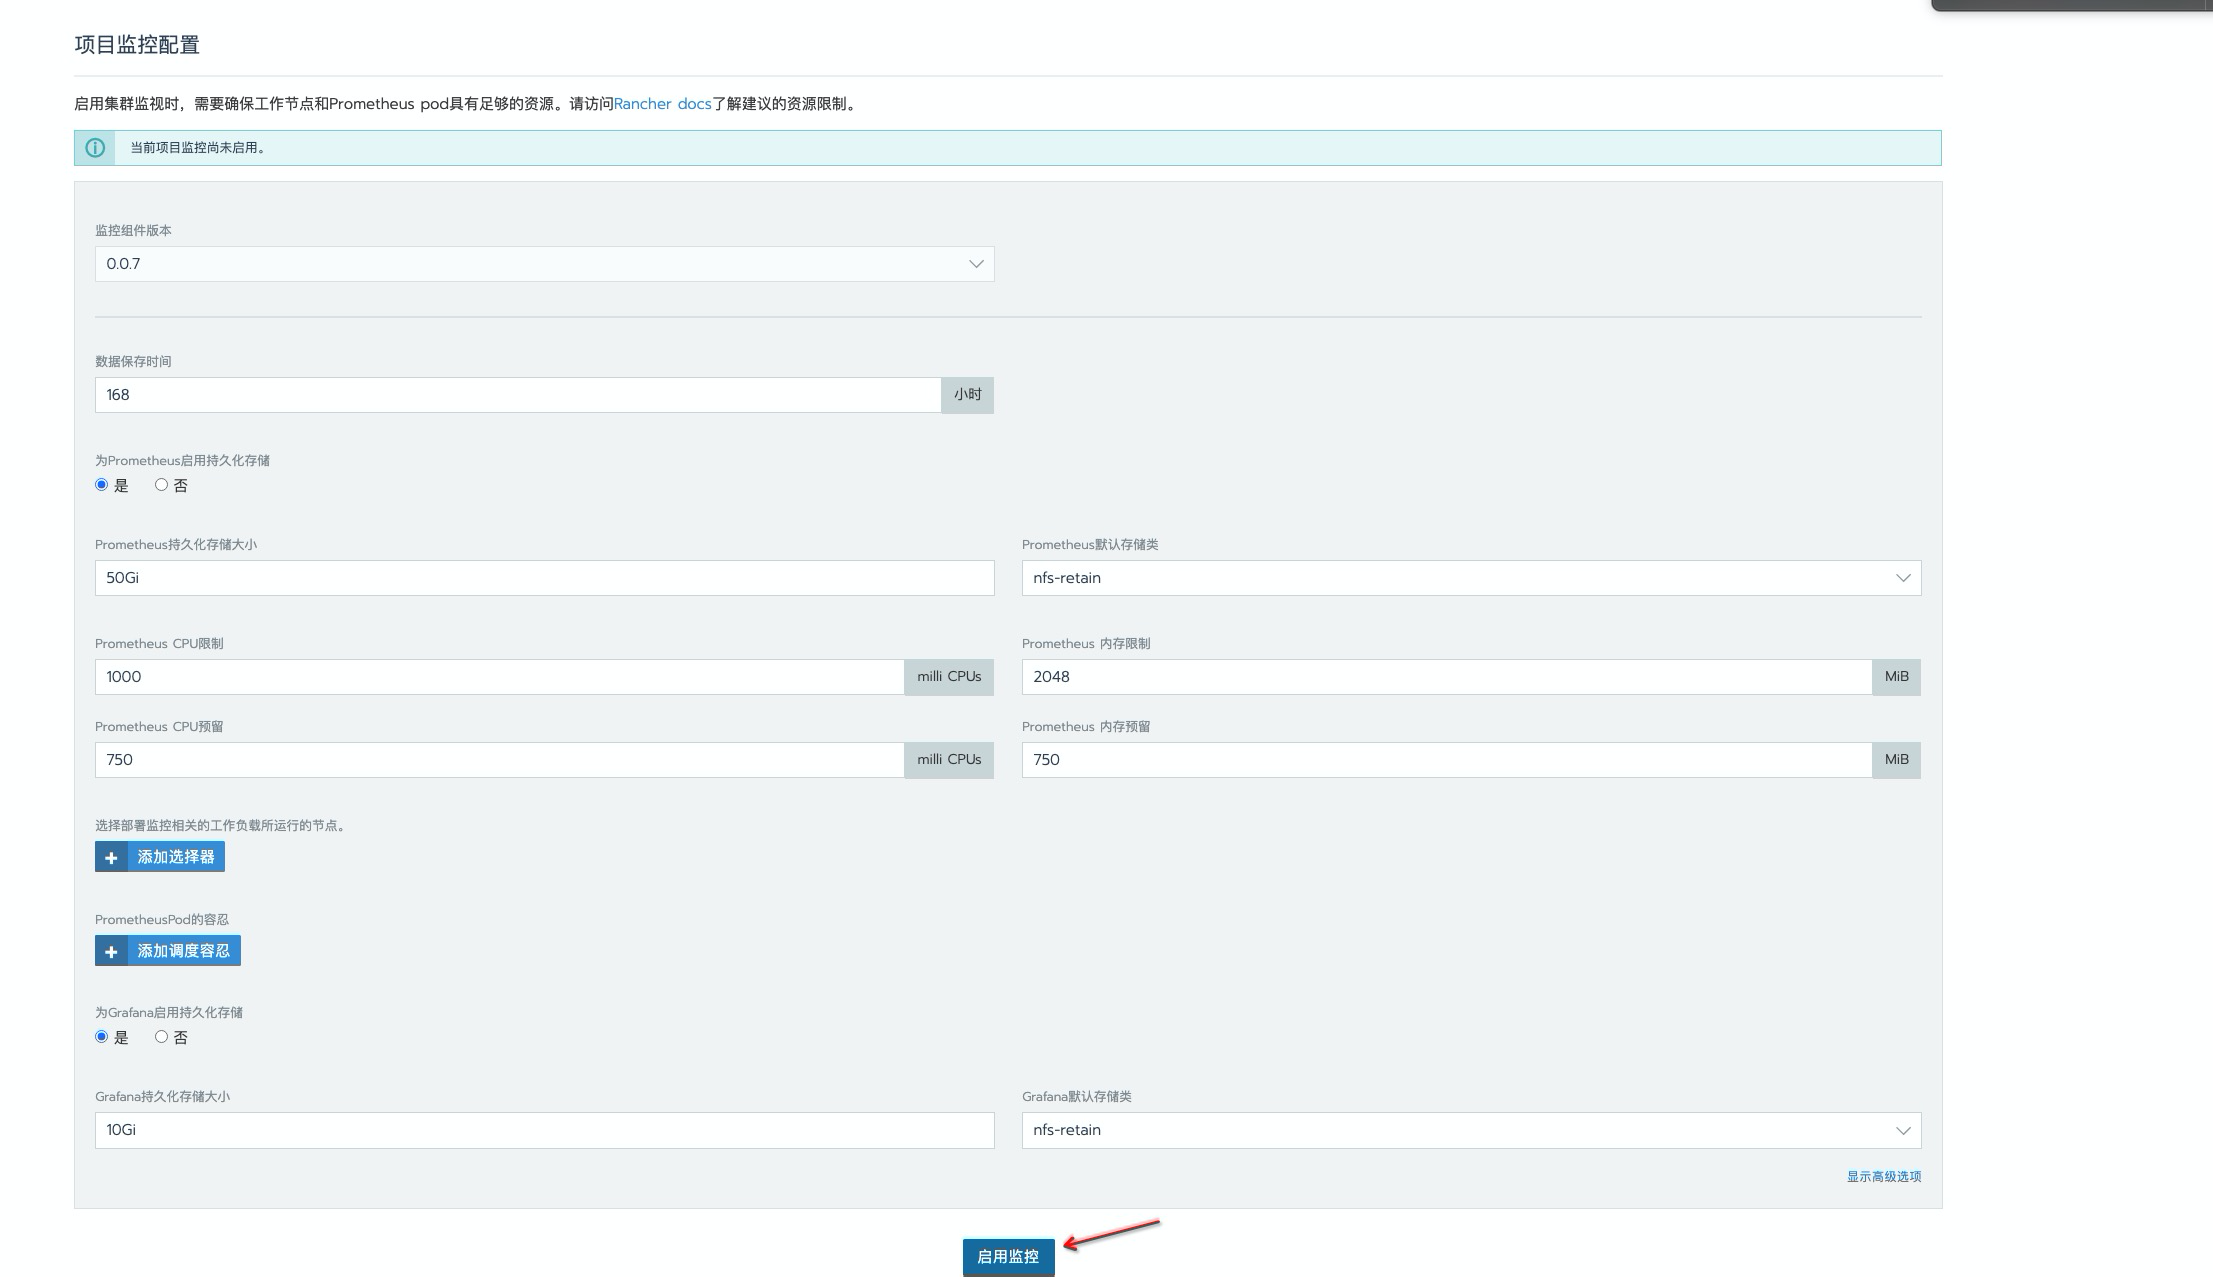
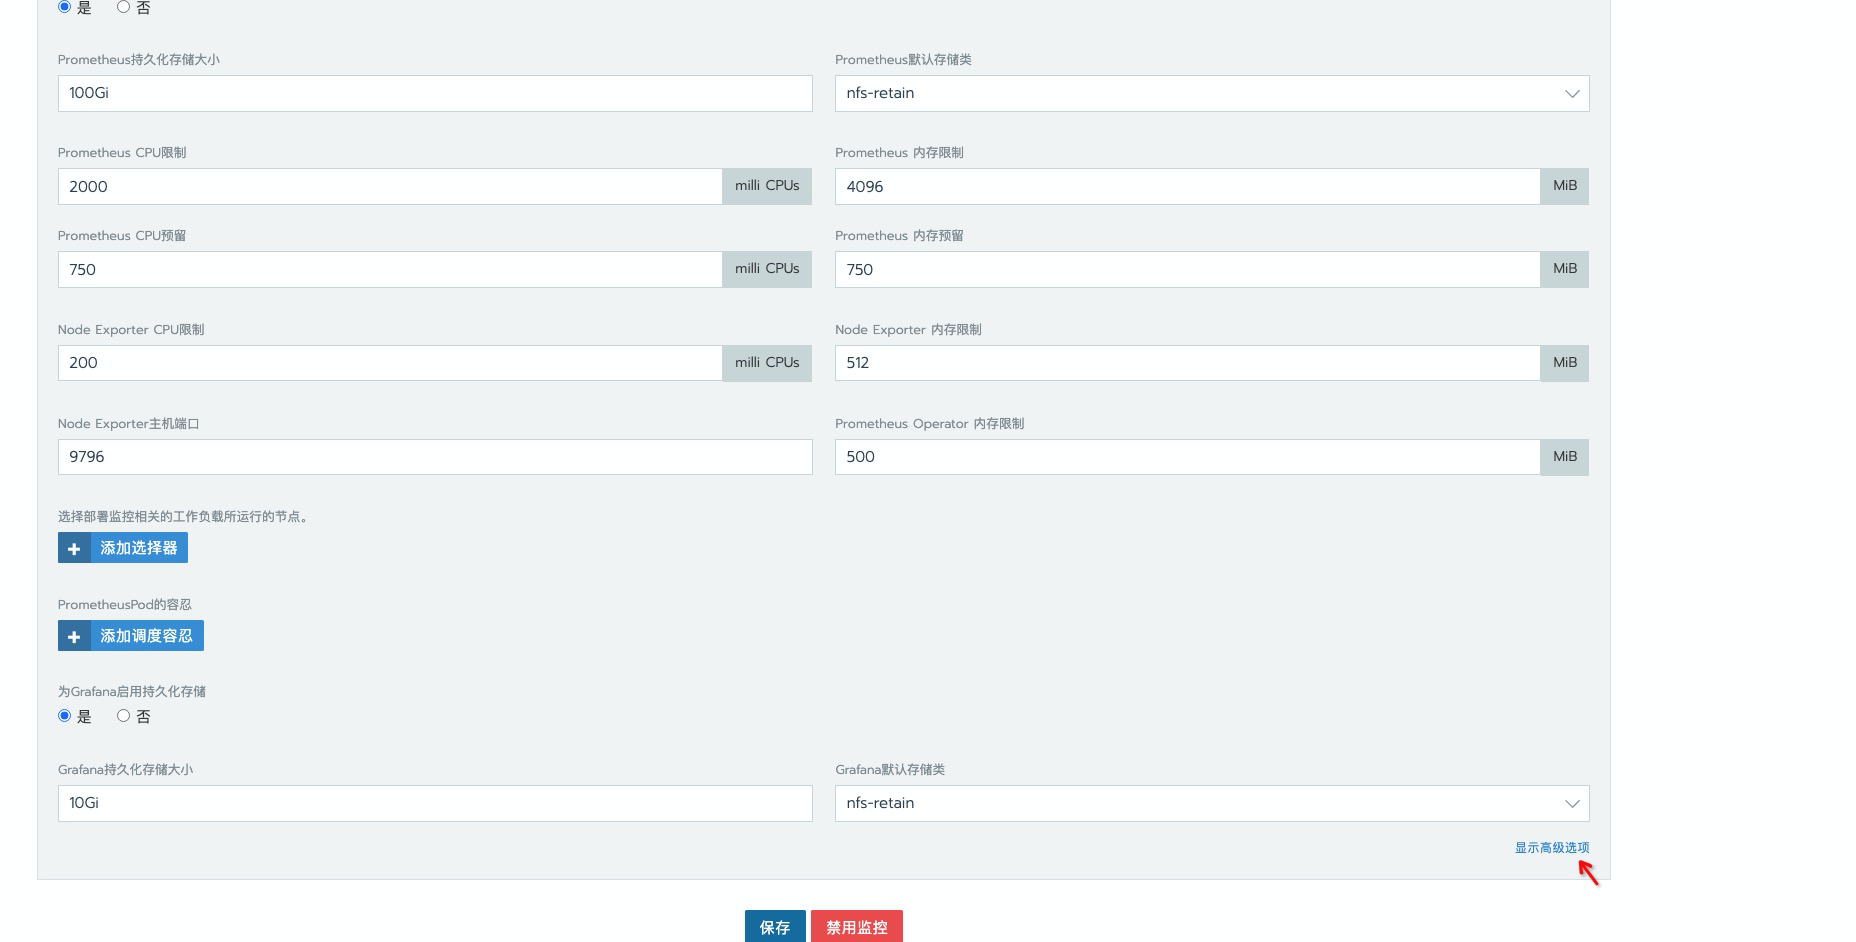
这里数据持久时间为
168h, 一般开发环境是够用了,生产环境按需延长就好。使用存储类为nfs,如有条件建议更换为分布式存储,如 ceph,解决 nfs单点故障问题。资源限制这里做了增大处理,毕竟 prometheus 数据是先暂存到内存中,在一定时间后定期刷新到磁盘上去的,还是比较吃内存的,为避免出现oomkill情况,建议最少也的配置一个 4g 内存。
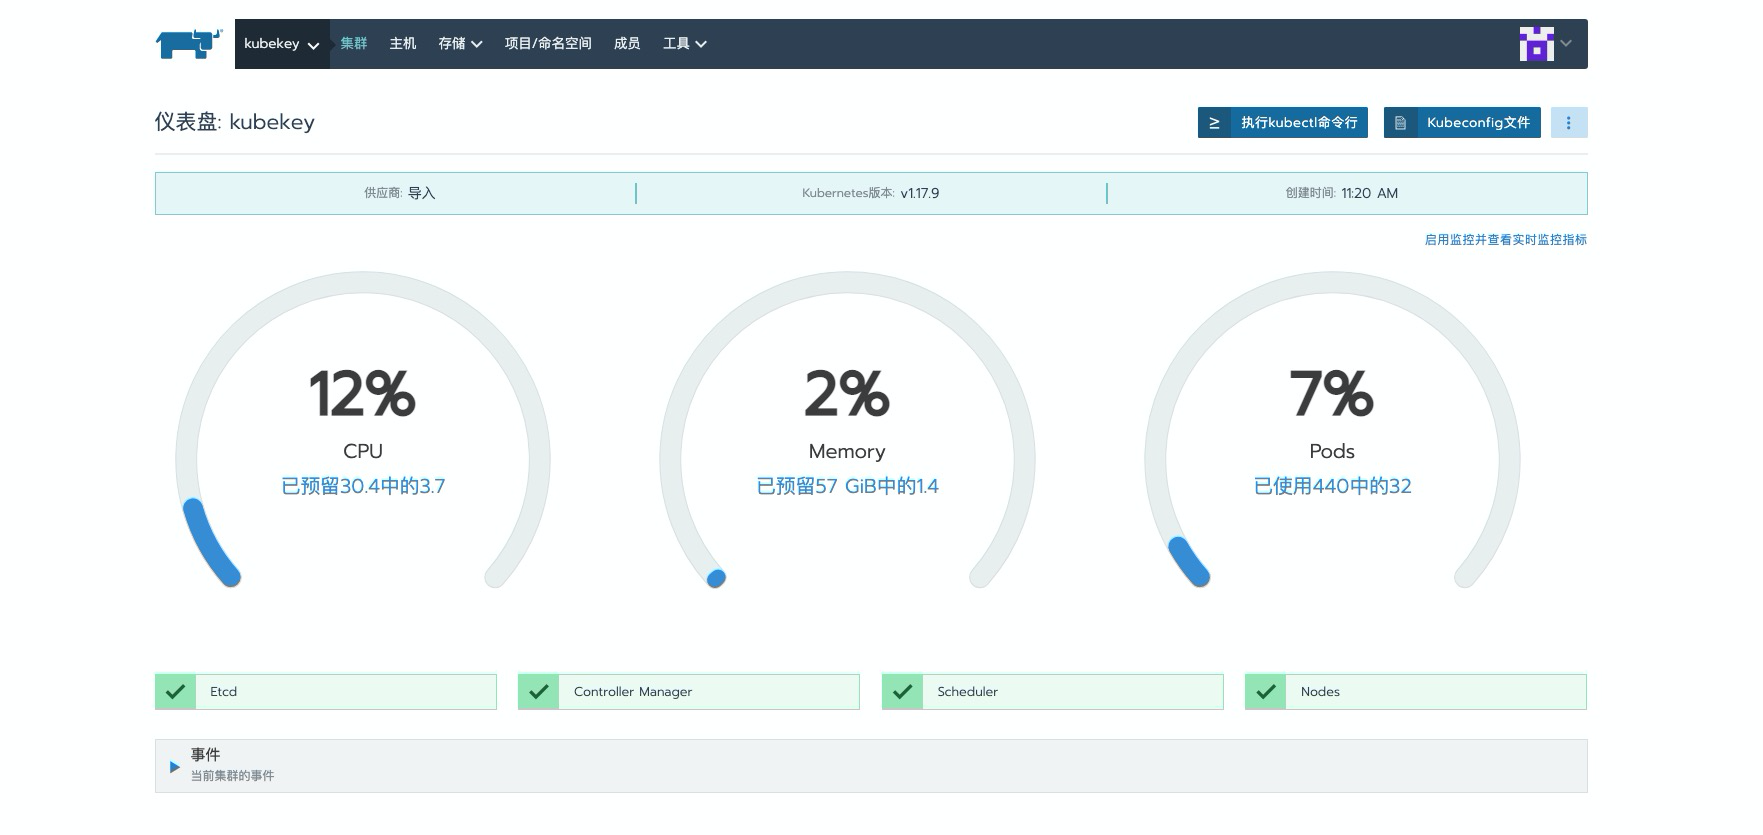
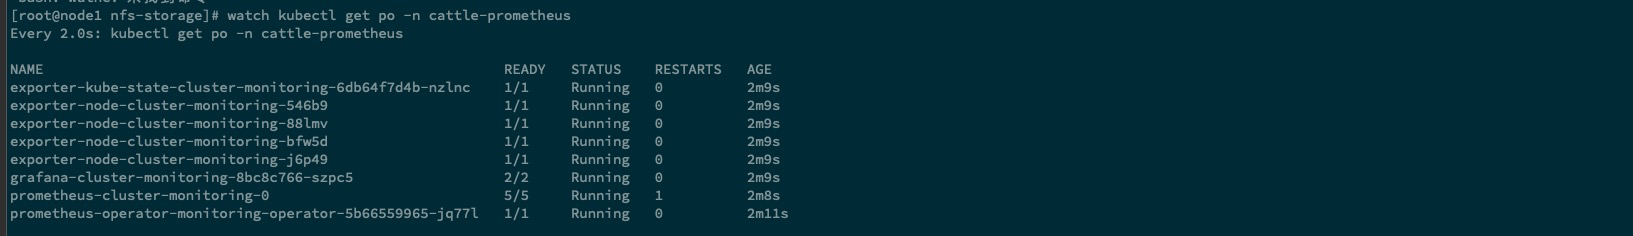
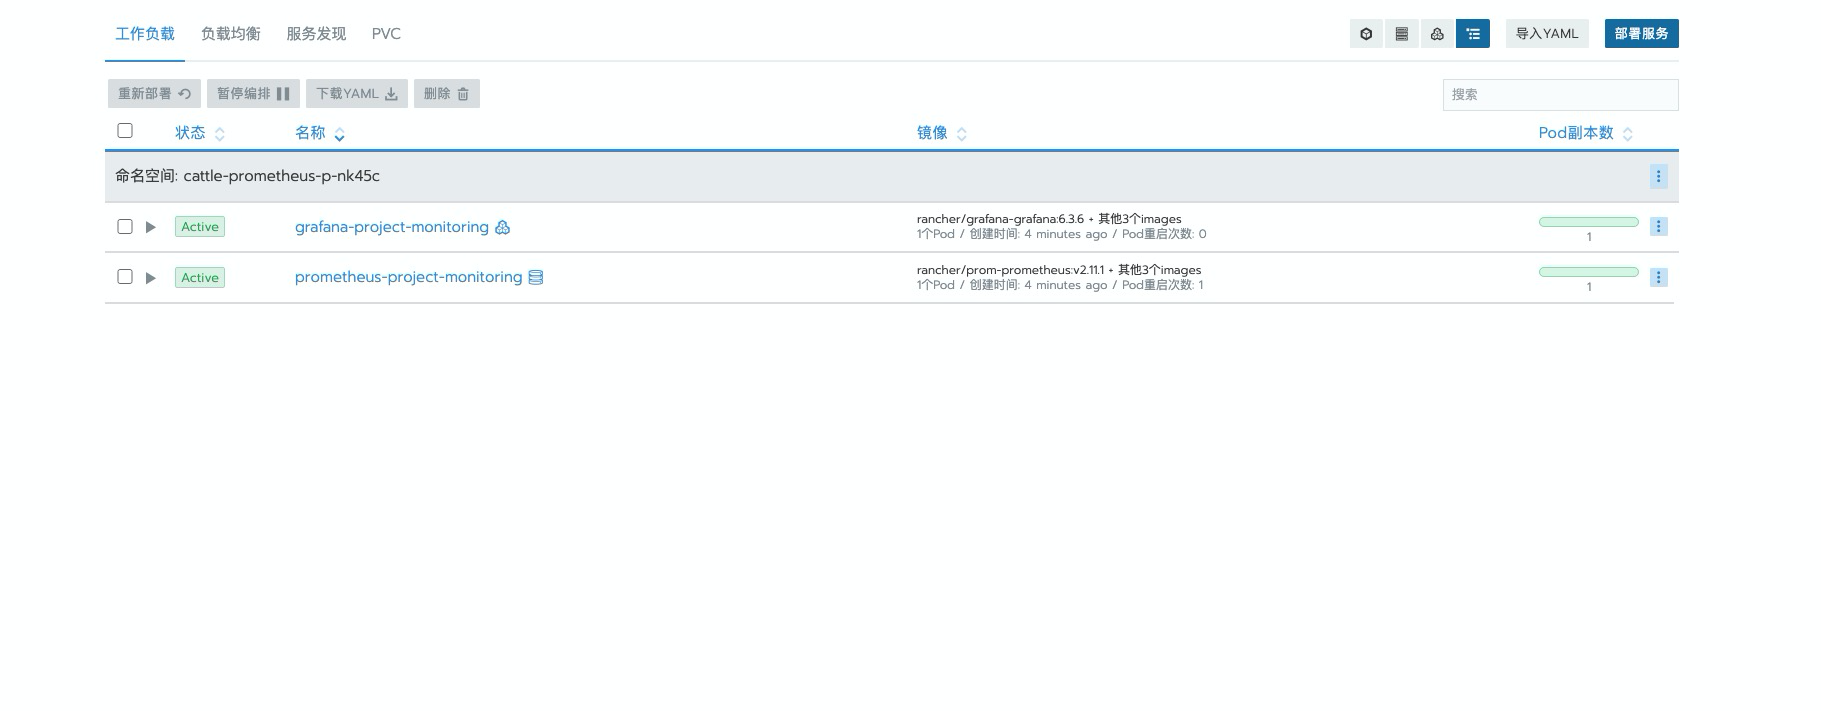
等待所有 pod 启动完成,命名空间为 cattle-prometheus
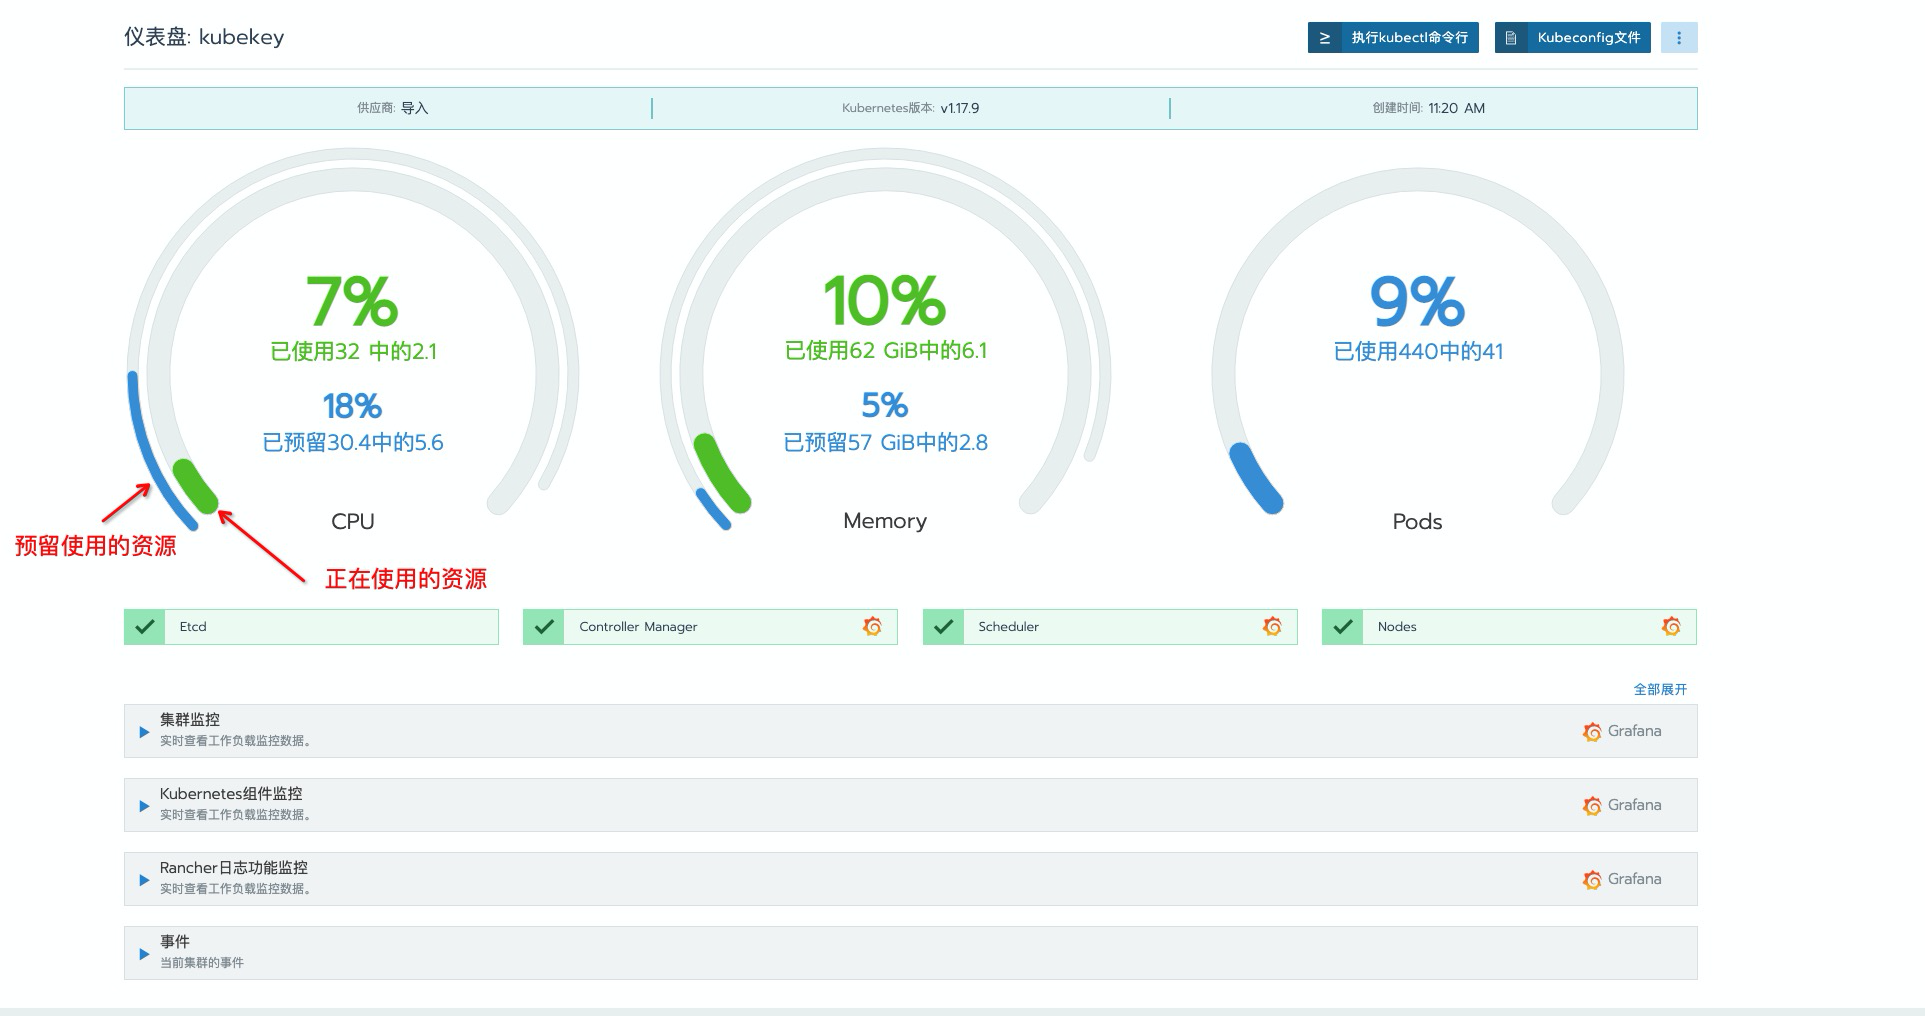
可以看到,再次登录页面查看时,页面也已经丰富了许多。这里需要特别主要以下这个聚合图标,
蓝色为集群资源限制中limits所预留占用的资源的聚合,绿色为集群目前正在使用的资源情况。
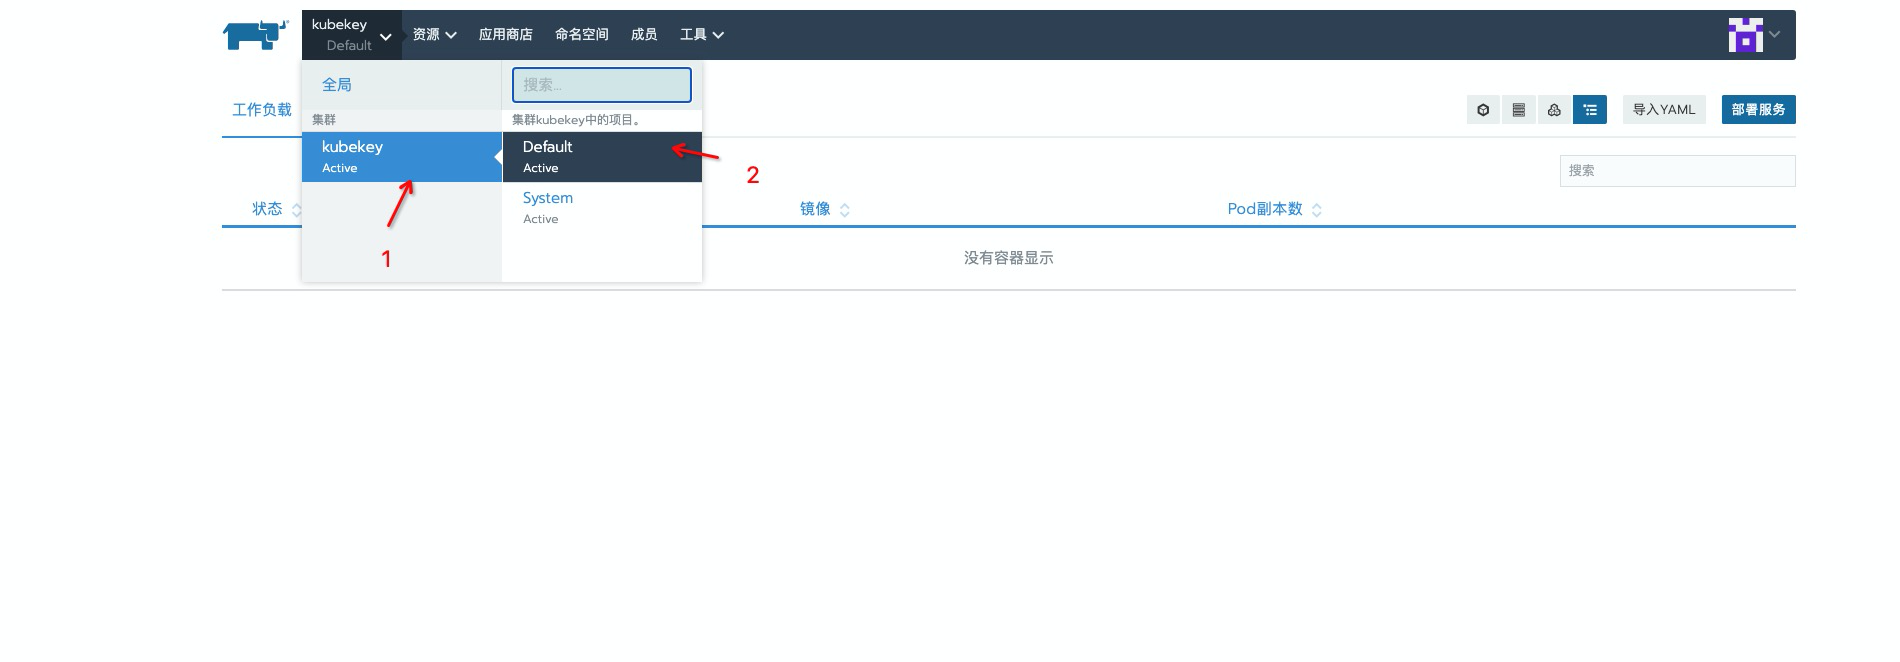
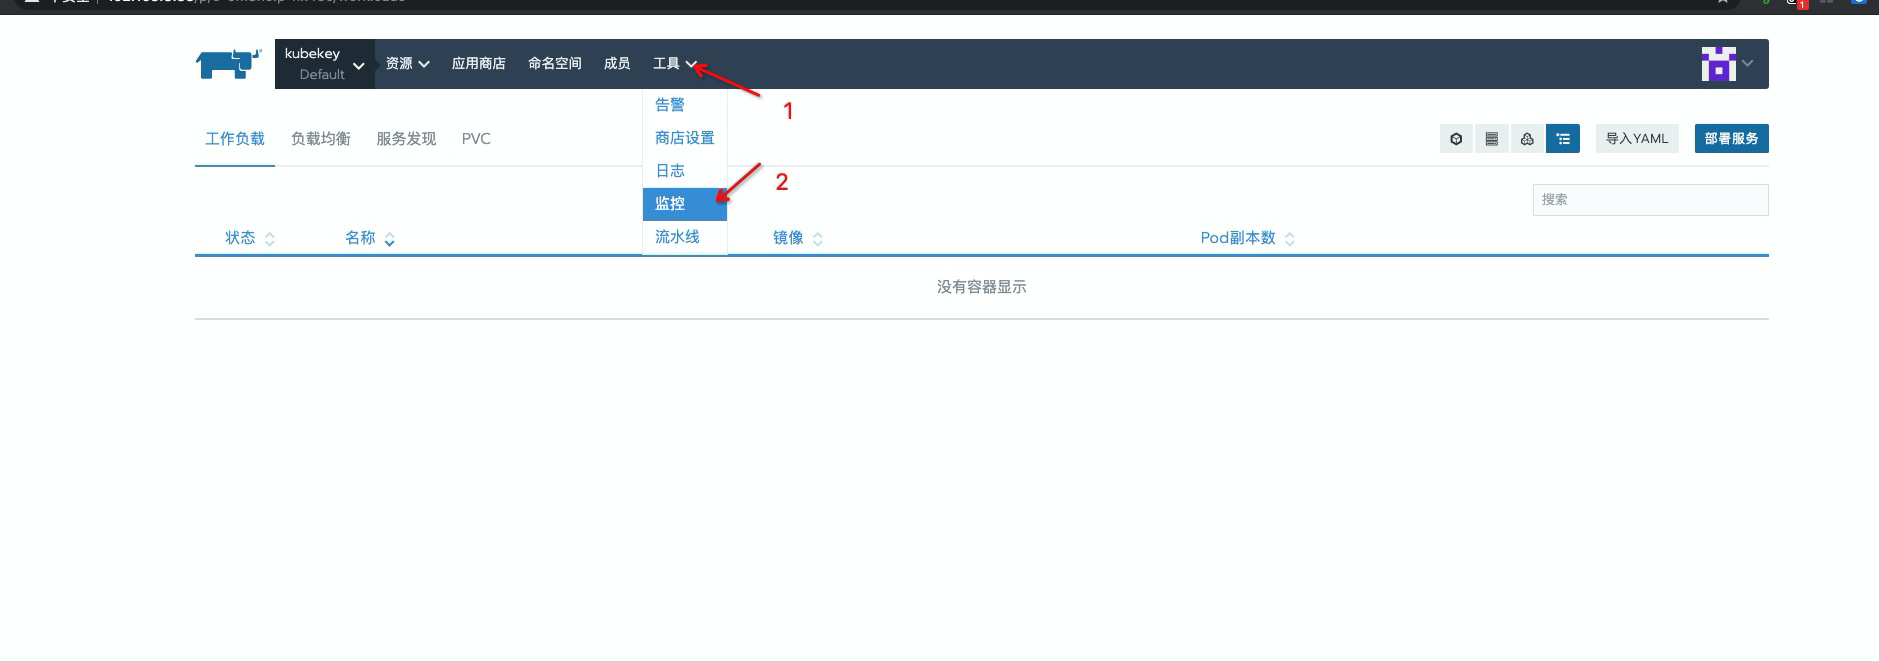
开启项目级别监控#
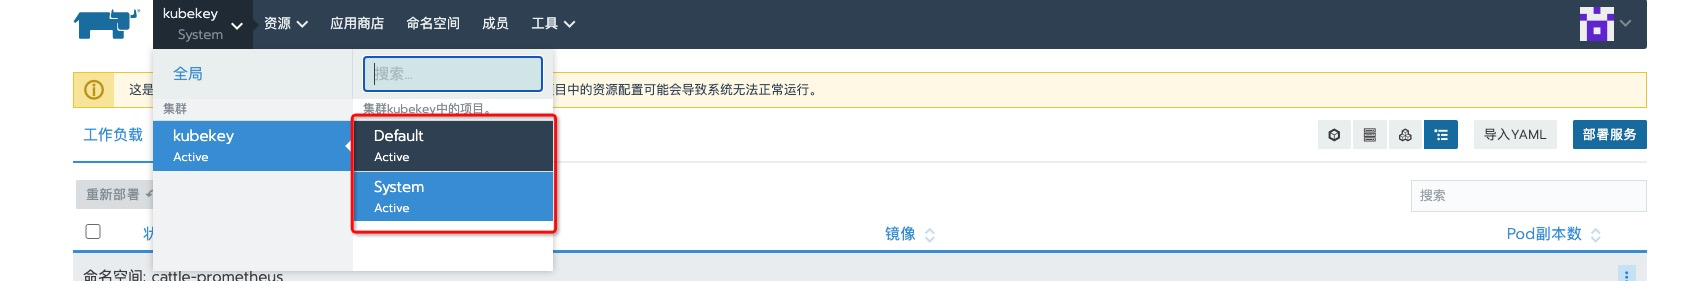
这个就是 rancher 中的项目,属于是 rancher 中对
一组 namespace集合的抽象。
选取需要开启监控的项目
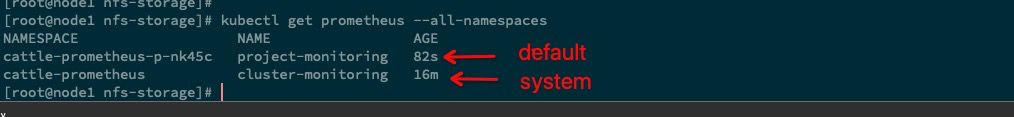
与系统层面的监控类似,这个多是基于 operator 中的
prometheus资源对象实现,后面会有详细的配置说明。
监控系统优化#
更改 service 模式为 NodePort#
虽然 rancher 对 prometheus operator 做了一层
多租户的处理,但是granfana却并没有做关联 rancher 的多租户处理, grafana 默认 U/Padmin/admin。个人觉得监控系统的多租户不是很好用,使用起来也有点有点鸡肋。这里演示配置将 service 更改为NodePort模式,绕过 rancher 多租户进行使用。
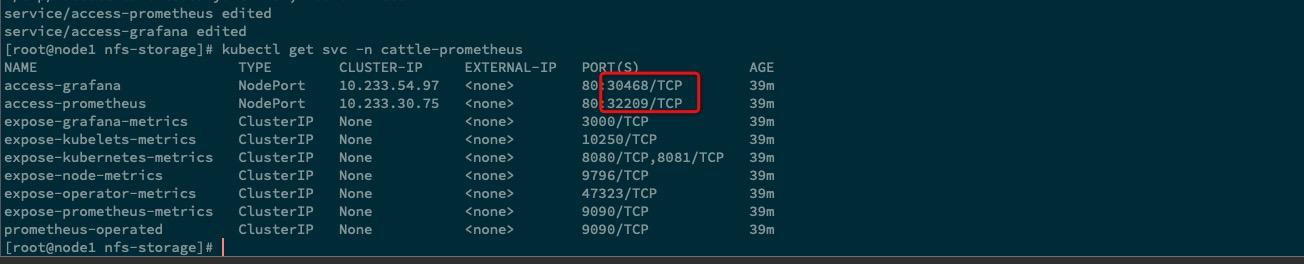
查看 目前 service 资源对象
kubectl get svc -n cattle-prometheus
access-grafana              ClusterIP   10.233.54.97   <none>        80/TCP              24m
access-prometheus           ClusterIP   10.233.30.75   <none>        80/TCP              24m
expose-grafana-metrics      ClusterIP   None           <none>        3000/TCP            24m
expose-kubelets-metrics     ClusterIP   None           <none>        10250/TCP           24m
expose-kubernetes-metrics   ClusterIP   None           <none>        8080/TCP,8081/TCP   24m
expose-node-metrics         ClusterIP   None           <none>        9796/TCP            24m
expose-operator-metrics     ClusterIP   None           <none>        47323/TCP           24m
expose-prometheus-metrics   ClusterIP   None           <none>        9090/TCP            24m
prometheus-operated         ClusterIP   None           <none>        9090/TCP            24m
更改 access-grafana & access-prometheus 这两个 service 资源对象,除了这两个资源对象外,应该还有一个 access-alertmanager 才对,不过这个我们后面才会介绍使用到,这里不做过多的赘述。
kubectl edit svc access-prometheus access-grafana -n cattle-prometheus

...
  selector:
    app: prometheus
    chart: prometheus-0.0.1
    release: cluster-monitoring
  sessionAffinity: ClientIP
  sessionAffinityConfig:
    clientIP:
      timeoutSeconds: 10800
  type: NodePort  # 将这个字段更改为 NodePort 即可
...
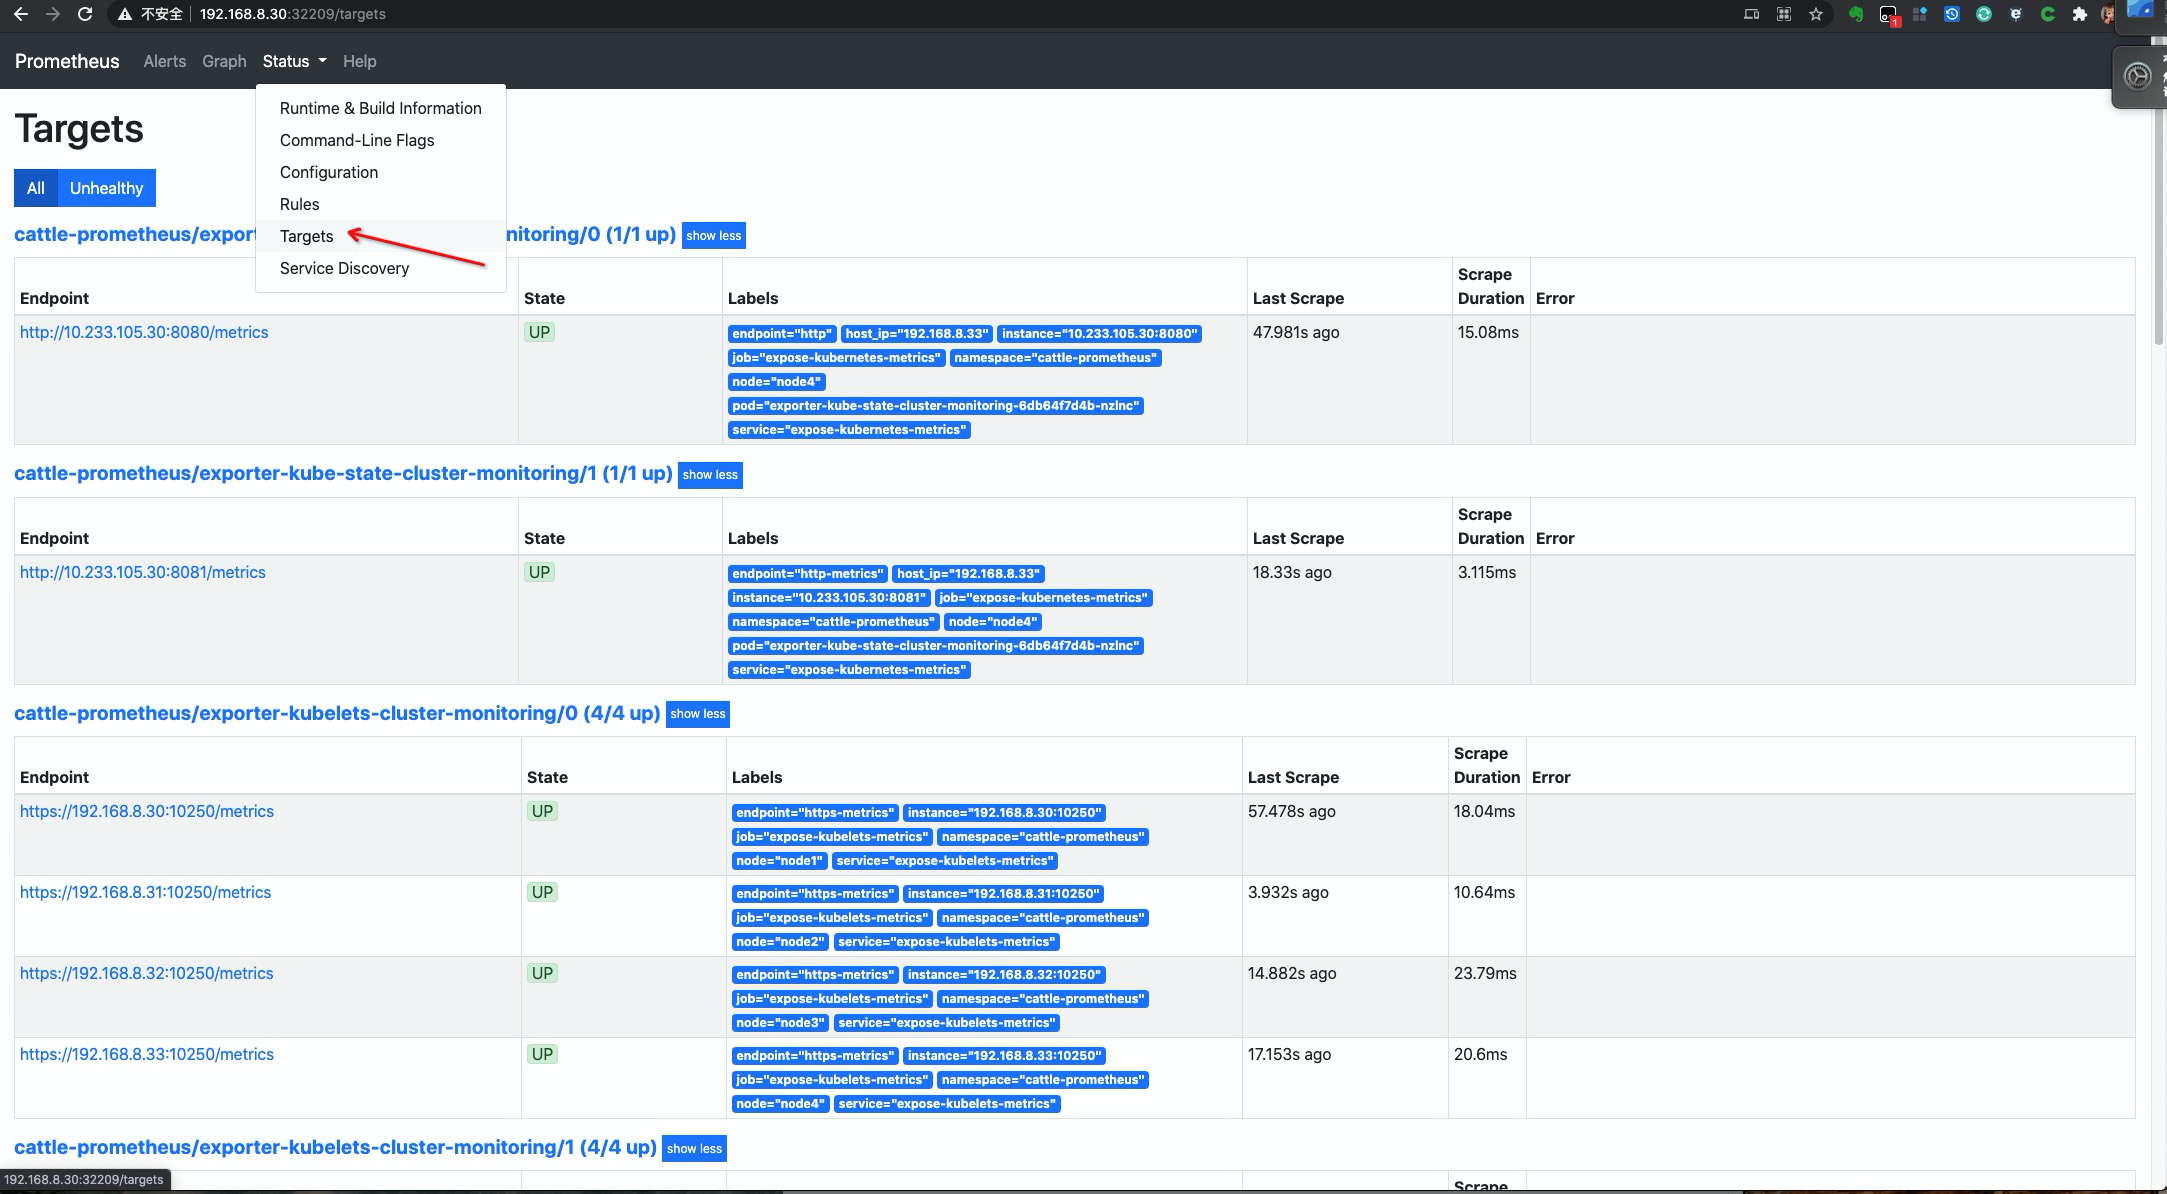
访问一下 prometheus
安装 metrics-server#
如果我们后面需要使用
HPA,就需要在集群中安装Metrics Server服务,要安装Metrics Server就需要开启 apiserver 的Aggregator,因为Metrics Server就是通过该代理进行扩展的,如果使用的是 Kubeadm (kubekey 也是基于 kubeadm) 搭建的,默认就已经是开启状态了,如果是二进制方式安装的集群,需要单独配置 kube-apsierver 添加参数,详细说明,请参考 此篇文档
执行安装
cat << EOF | kubectl apply -f -
apiVersion: v1
kind: ServiceAccount
metadata:
  labels:
    k8s-app: metrics-server
  name: metrics-server
  namespace: kube-system
---
apiVersion: rbac.authorization.k8s.io/v1
kind: ClusterRole
metadata:
  labels:
    k8s-app: metrics-server
    rbac.authorization.k8s.io/aggregate-to-admin: "true"
    rbac.authorization.k8s.io/aggregate-to-edit: "true"
    rbac.authorization.k8s.io/aggregate-to-view: "true"
  name: system:aggregated-metrics-reader
rules:
- apiGroups:
  - metrics.k8s.io
  resources:
  - pods
  - nodes
  verbs:
  - get
  - list
  - watch
---
apiVersion: rbac.authorization.k8s.io/v1
kind: ClusterRole
metadata:
  labels:
    k8s-app: metrics-server
  name: system:metrics-server
rules:
- apiGroups:
  - ""
  resources:
  - pods
  - nodes
  - nodes/stats
  - namespaces
  - configmaps
  verbs:
  - get
  - list
  - watch
---
apiVersion: rbac.authorization.k8s.io/v1
kind: RoleBinding
metadata:
  labels:
    k8s-app: metrics-server
  name: metrics-server-auth-reader
  namespace: kube-system
roleRef:
  apiGroup: rbac.authorization.k8s.io
  kind: Role
  name: extension-apiserver-authentication-reader
subjects:
- kind: ServiceAccount
  name: metrics-server
  namespace: kube-system
---
apiVersion: rbac.authorization.k8s.io/v1
kind: ClusterRoleBinding
metadata:
  labels:
    k8s-app: metrics-server
  name: metrics-server:system:auth-delegator
roleRef:
  apiGroup: rbac.authorization.k8s.io
  kind: ClusterRole
  name: system:auth-delegator
subjects:
- kind: ServiceAccount
  name: metrics-server
  namespace: kube-system
---
apiVersion: rbac.authorization.k8s.io/v1
kind: ClusterRoleBinding
metadata:
  labels:
    k8s-app: metrics-server
  name: system:metrics-server
roleRef:
  apiGroup: rbac.authorization.k8s.io
  kind: ClusterRole
  name: system:metrics-server
subjects:
- kind: ServiceAccount
  name: metrics-server
  namespace: kube-system
---
apiVersion: v1
kind: Service
metadata:
  labels:
    k8s-app: metrics-server
  name: metrics-server
  namespace: kube-system
spec:
  ports:
  - name: https
    port: 443
    protocol: TCP
    targetPort: https
  selector:
    k8s-app: metrics-server
---
apiVersion: apps/v1
kind: Deployment
metadata:
  labels:
    k8s-app: metrics-server
  name: metrics-server
  namespace: kube-system
spec:
  selector:
    matchLabels:
      k8s-app: metrics-server
  strategy:
    rollingUpdate:
      maxUnavailable: 0
  template:
    metadata:
      labels:
        k8s-app: metrics-server
    spec:
      containers:
      - args:
        - --cert-dir=/tmp
        - --secure-port=4443
        - --kubelet-preferred-address-types=InternalIP,ExternalIP,Hostname
        - --kubelet-use-node-status-port
        - --kubelet-insecure-tls
        image: k8s.gcr.io/metrics-server/metrics-server:v0.4.4
        imagePullPolicy: IfNotPresent
        livenessProbe:
          failureThreshold: 3
          httpGet:
            path: /livez
            port: https
            scheme: HTTPS
          periodSeconds: 10
        name: metrics-server
        ports:
        - containerPort: 4443
          name: https
          protocol: TCP
        readinessProbe:
          failureThreshold: 3
          httpGet:
            path: /readyz
            port: https
            scheme: HTTPS
          periodSeconds: 10
        securityContext:
          readOnlyRootFilesystem: true
          runAsNonRoot: true
          runAsUser: 1000
        volumeMounts:
        - mountPath: /tmp
          name: tmp-dir
      nodeSelector:
        kubernetes.io/os: linux
      priorityClassName: system-cluster-critical
      serviceAccountName: metrics-server
      volumes:
      - emptyDir: {}
        name: tmp-dir
---
apiVersion: apiregistration.k8s.io/v1
kind: APIService
metadata:
  labels:
    k8s-app: metrics-server
  name: v1beta1.metrics.k8s.io
spec:
  group: metrics.k8s.io
  groupPriorityMinimum: 100
  insecureSkipTLSVerify: true
  service:
    name: metrics-server
    namespace: kube-system
  version: v1beta1
  versionPriority: 100
EOF
检查 pod 启动情况
kubectl get pods -n kube-system -l k8s-app=metrics-server
NAME                              READY   STATUS    RESTARTS   AGE
metrics-server-75b868857d-bpbb6   1/1     Running   0          75s

kubectl top nodes
NAME    CPU(cores)   CPU%   MEMORY(bytes)   MEMORY%
node1   422m         5%     1865Mi          12%
node2   241m         3%     1598Mi          10%
node3   317m         4%     1737Mi          11%
node4   236m         3%     1123Mi          7%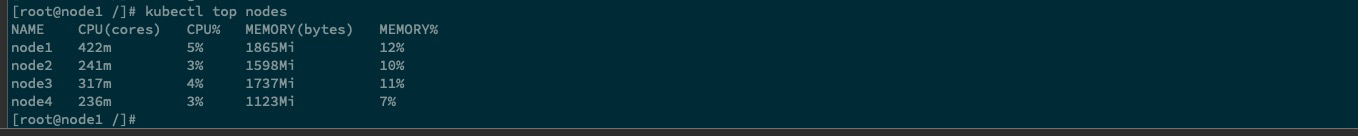
显示有指标即正常
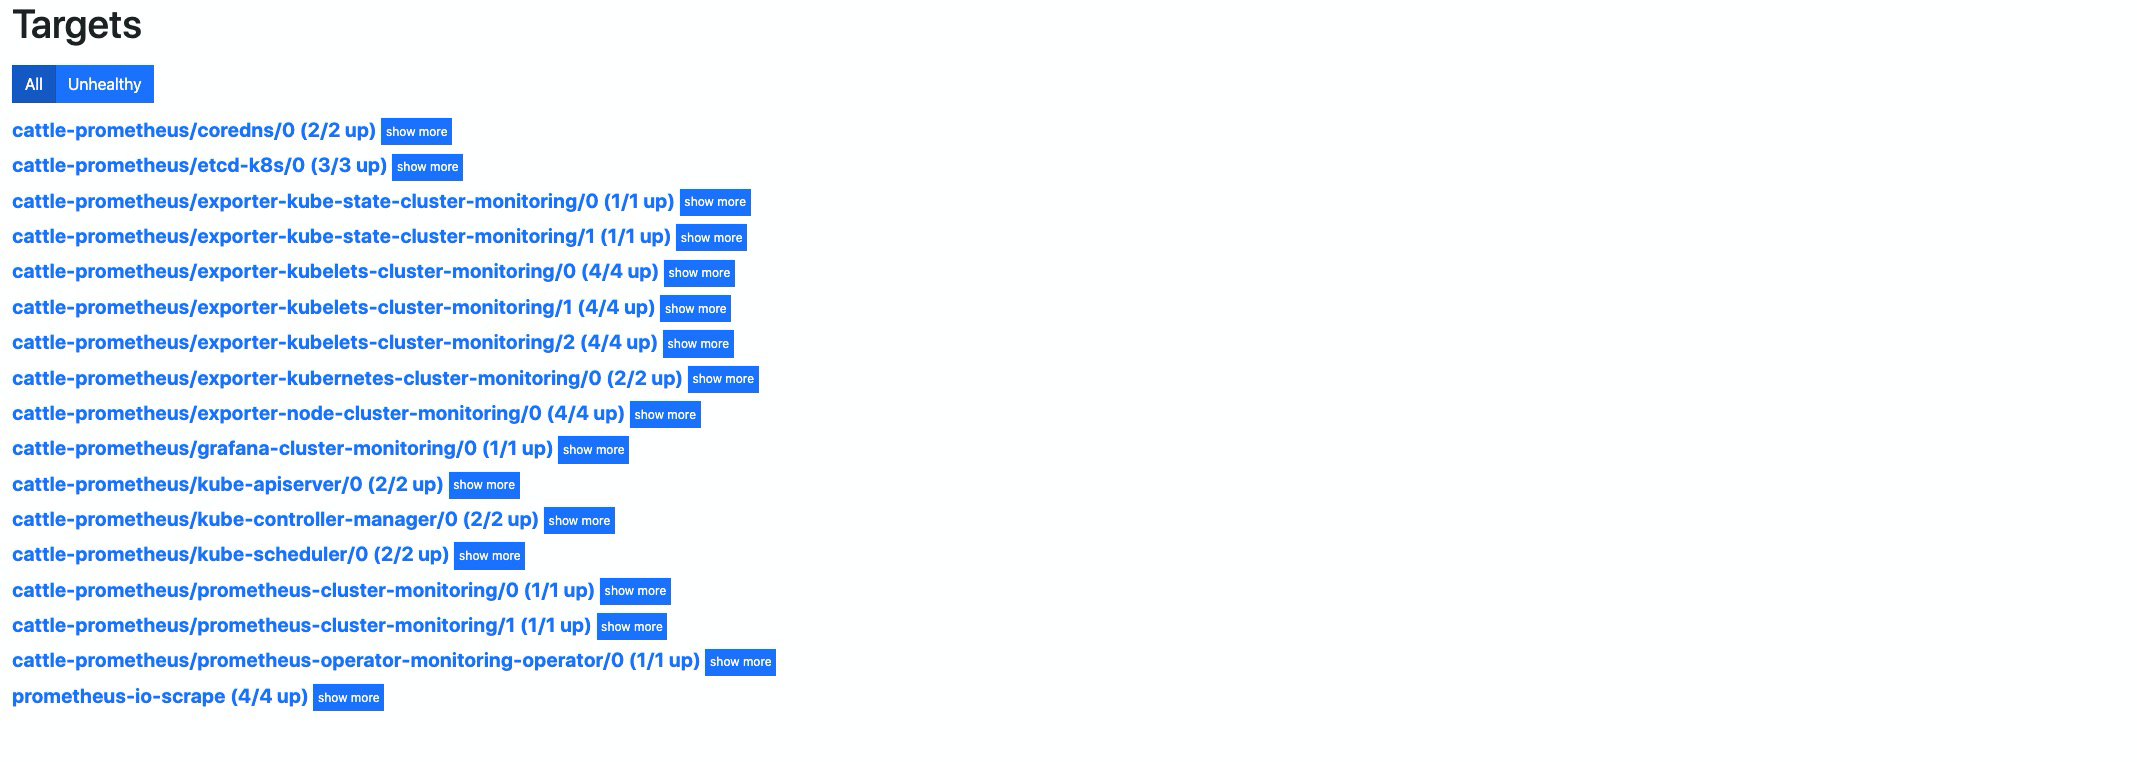
配置 targets 自动发现说明#
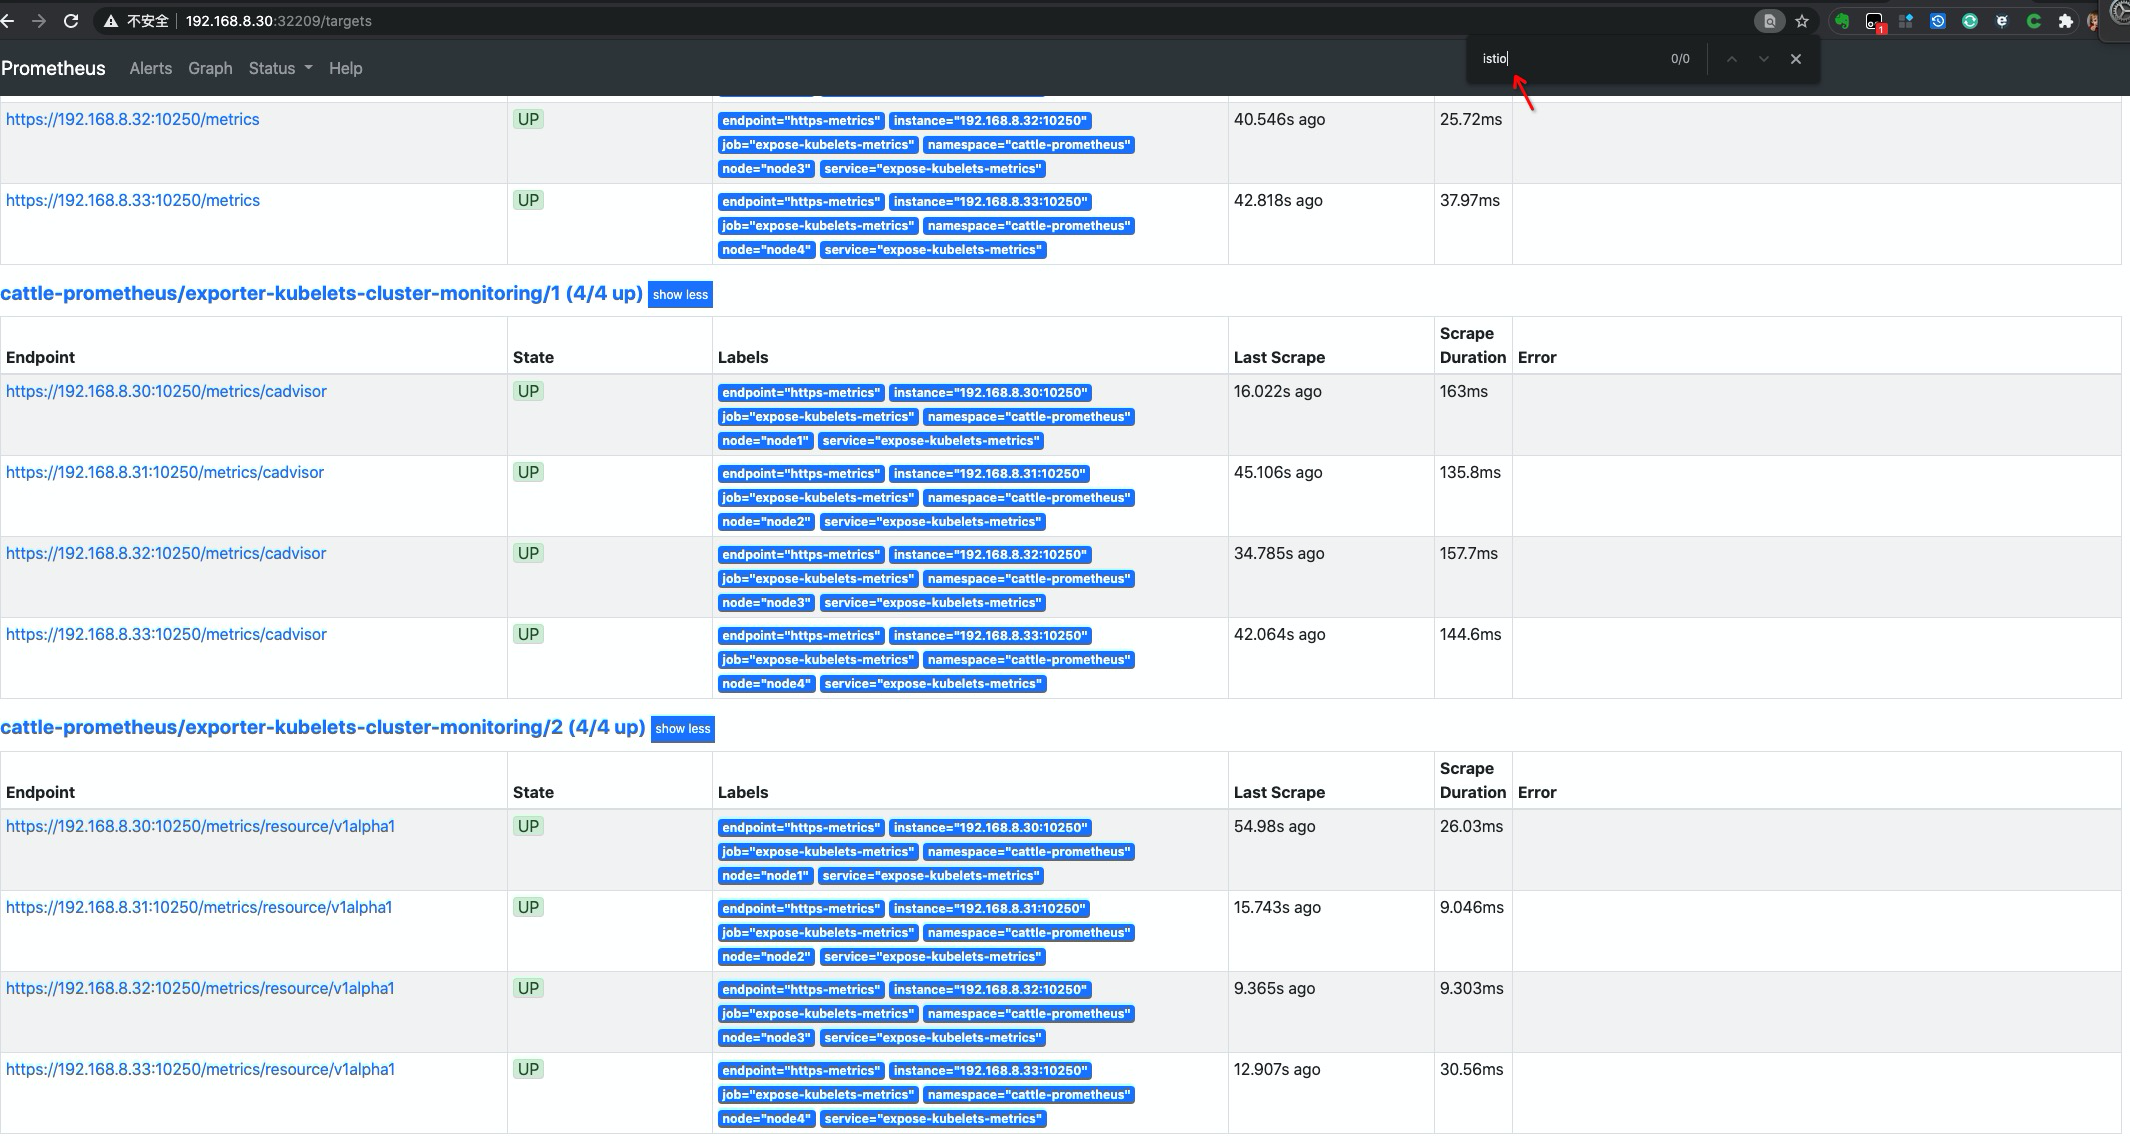
可以看到在上面发现的列表中,并没有
etcd、controller-manager、scheduler、apserver、coredns这几个指标的出现,而且中间不妨出现了一些无法发现指标的配置项。下面介绍如何对这些缺失指标的修复,与无用指标的删除配置说明。
清理无用指标#
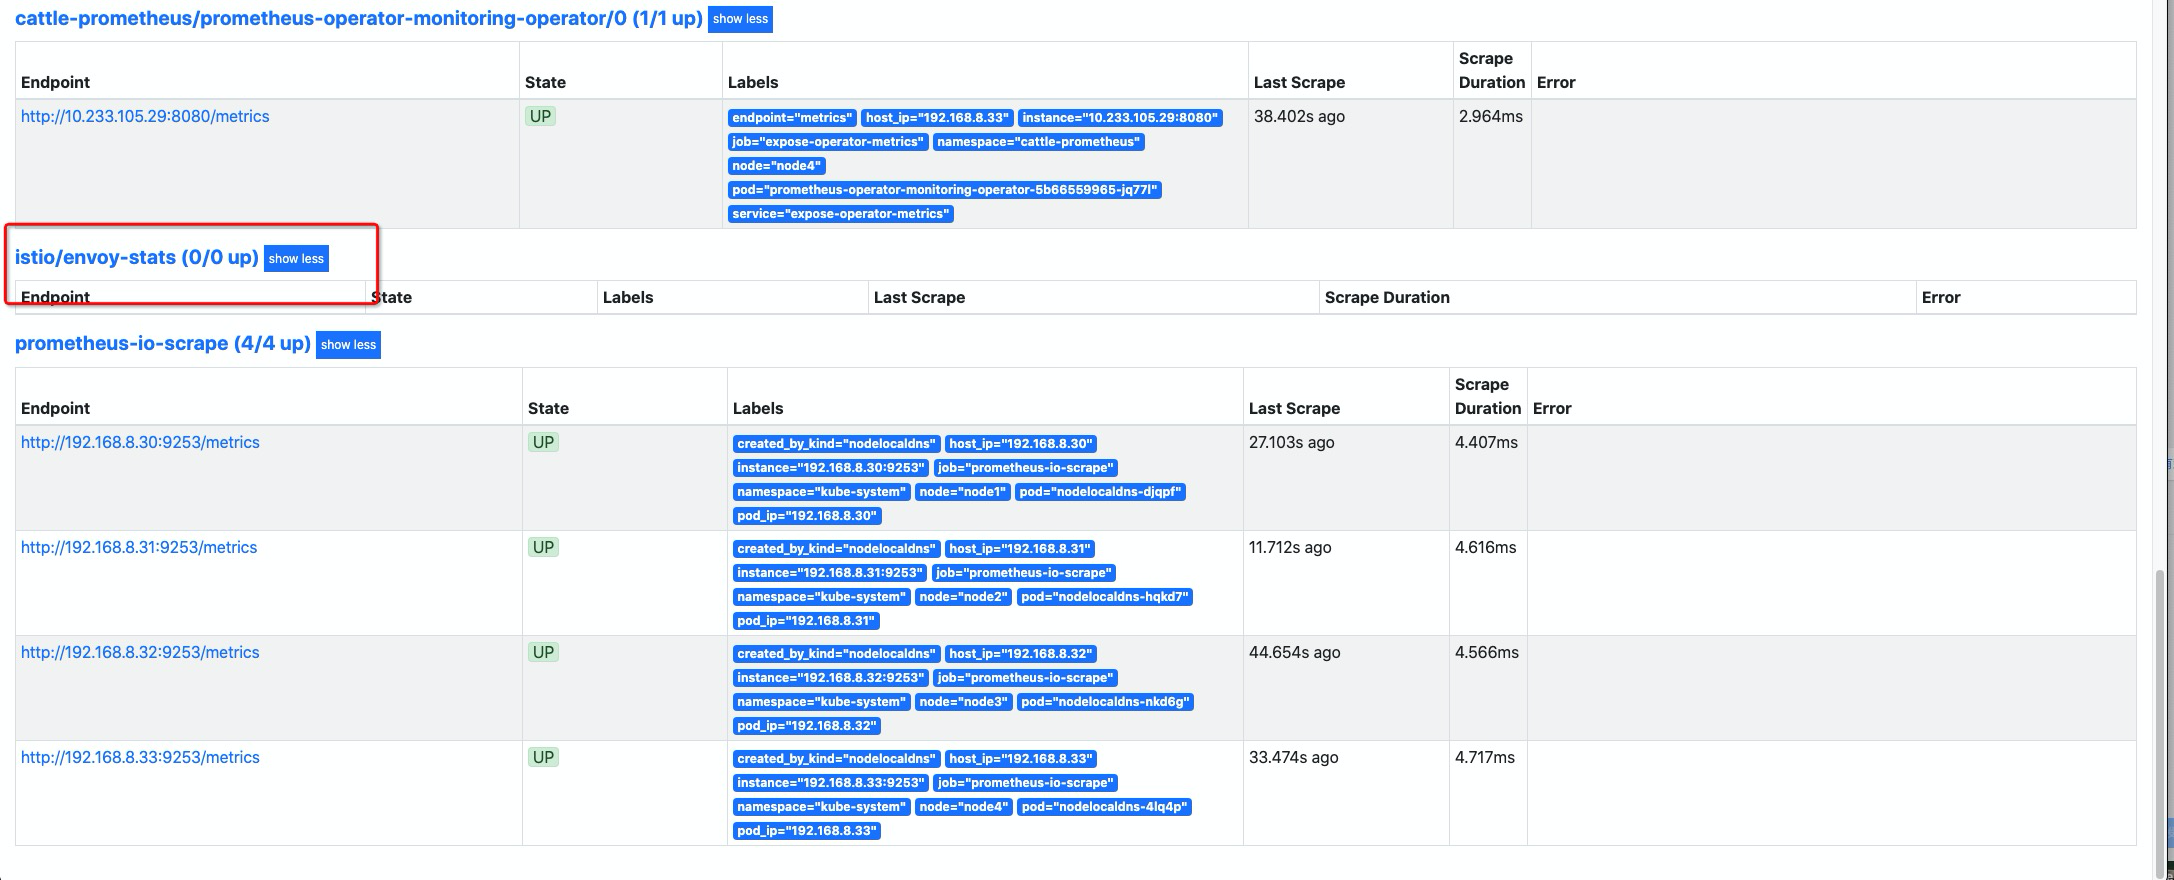
清理
istio对应 envoy 服务发现,这个是 rancher monitor chart 中默认渲染的,这里我们在渲染时,关闭掉渲染即可。
系统层面监控 添加配置
添加应答配置
prometheus.istioMonitoring.enabled=falseexporter-fluentd.enabled=false
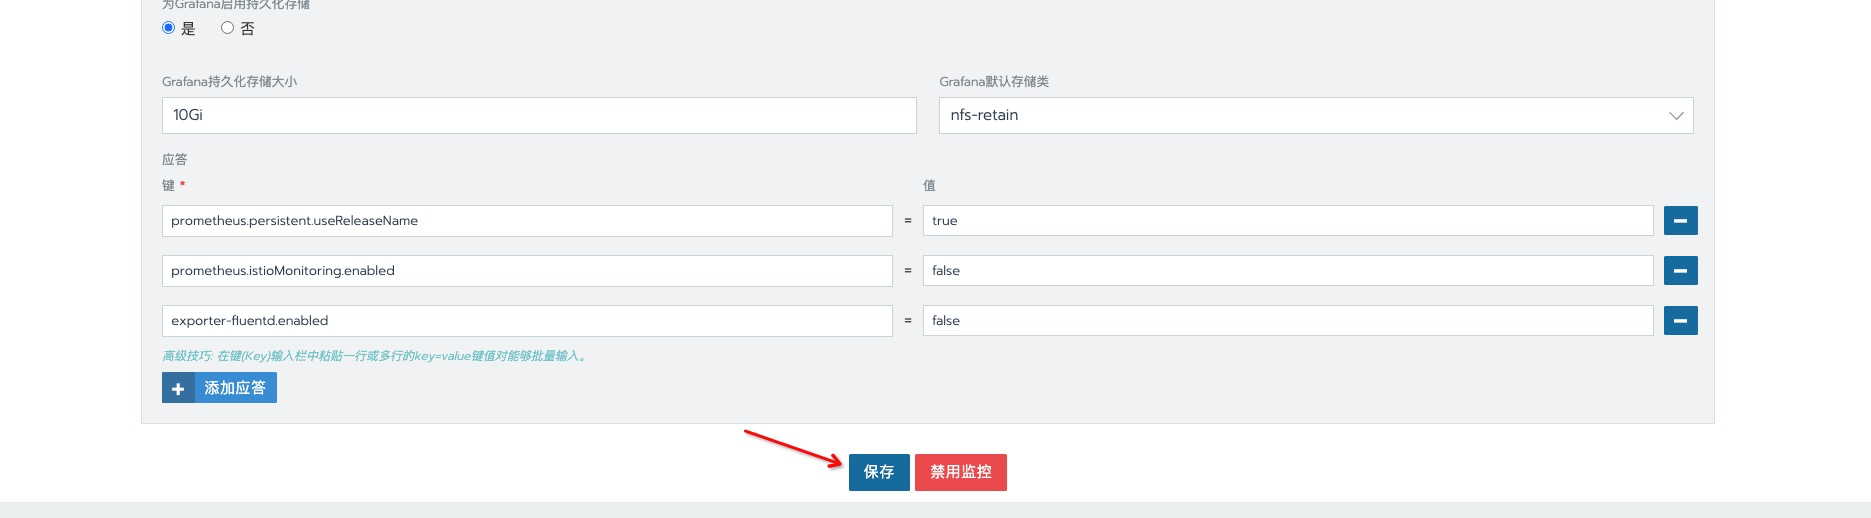
保存并应该配置,等待生效后,已找不到 与
istio有关的配置项。
添加 targets 指标发现#
下面介绍的几种
targets指标发现,使用与 集群 内外的 metrics,参照下面的配置说明,添加配置即可。
添加 etcd 指标发现#
添加 etcd service 资源对象
cat << EOF | kubectl apply -f -
apiVersion: v1
kind: Service
metadata:
  name: etcd-k8s
  namespace: kube-system
  labels:
    k8s-app: etcd
spec:
  type: ClusterIP
  clusterIP: None
  ports:
    - name: port
      port: 2381
---
apiVersion: v1
kind: Endpoints
metadata:
  name: etcd-k8s
  namespace: kube-system
  labels:
    k8s-app: etcd
subsets:
  - addresses:
      - ip: 192.168.8.30 # 指定etcd节点地址,集群节点继续向下添加
        nodeName: node1
    ports:
      - name: port
        port: 2381
  - addresses:
      - ip: 192.168.8.31
        nodeName: node2
    ports:
      - name: port
        port: 2381
  - addresses:
      - ip: 192.168.8.32
        nodeName: node3
    ports:
      - name: port
        port: 2381
EOF
创建 etcd
ServiceMonitor资源对象cat << EOF | kubectl apply -f - apiVersion: monitoring.coreos.com/v1 kind: ServiceMonitor metadata: name: etcd-k8s namespace: cattle-prometheus labels: k8s-app: etcd-k8s spec: jobLabel: k8s-app endpoints: - port: port interval: 15s selector: matchLabels: k8s-app: etcd namespaceSelector: matchNames: - kube-system EOF
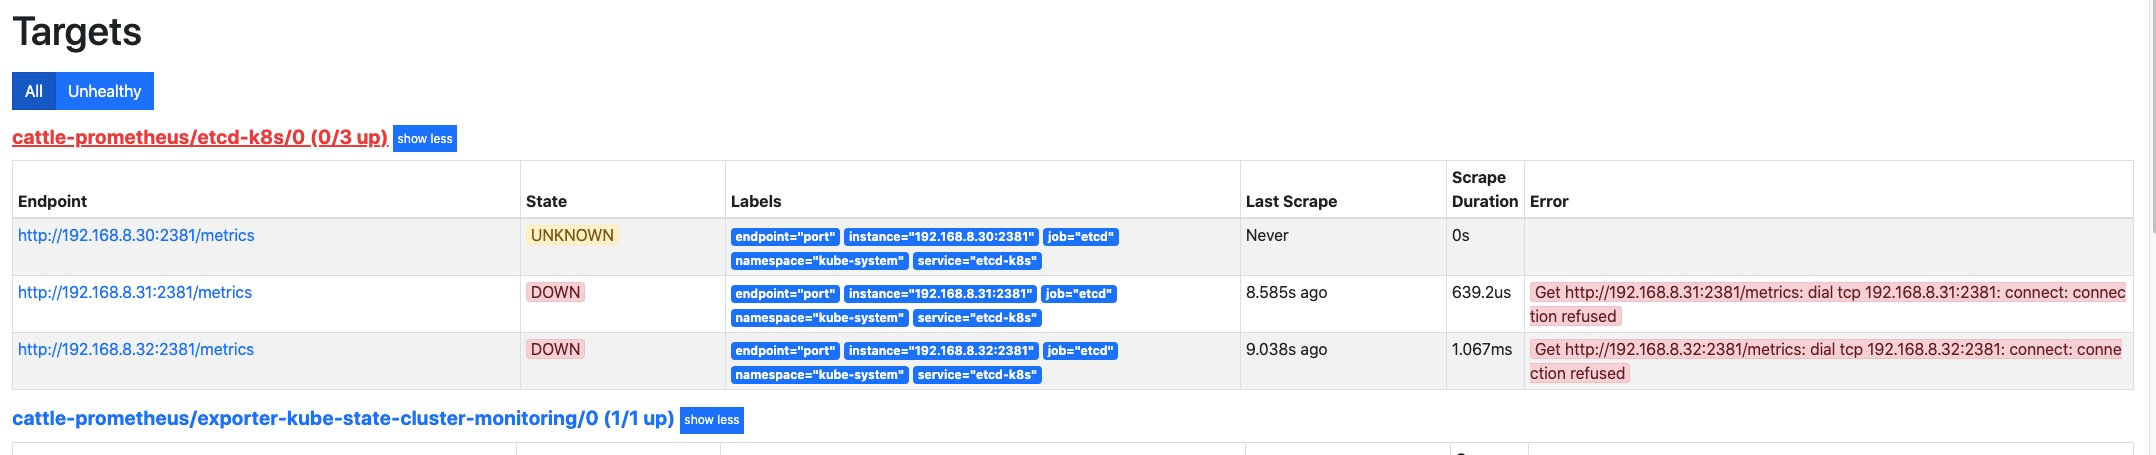
等待 operator 自动将配置加载完成,可以看到这里已经有对应的配置项了,但是好像无法抓取到
metrics指标。这是因为默认 etcd 的 metrics 监听在127.0.0.1的地址上,我们拿的是192.168.8.0/24的地址去访问就自然无法访问到了。
更改 etcd
metrics指标监听地址这里示例使用的是
kubekey部署的集群,etcd 不是使用的 kubeadm 中静态pod进行管理的,更改配置文件为/etc/etcd.env, 如果你是使用的kubeadm只需要修改静态pod配置文件/etc/kubernetes/manifests/etcd.yaml中的listen-metrics-urls配置项为--listen-metrics-urls=http://0.0.0.0:2381即可。echo '# add coustom settings ETCD_LISTEN_METRICS_URLS=http://0.0.0.0:2381' >> /etc/etcd.env # 添加配置 service etcd restart # 重启服务生效其他 etcd 环境变量说明, 请参考如下 文档
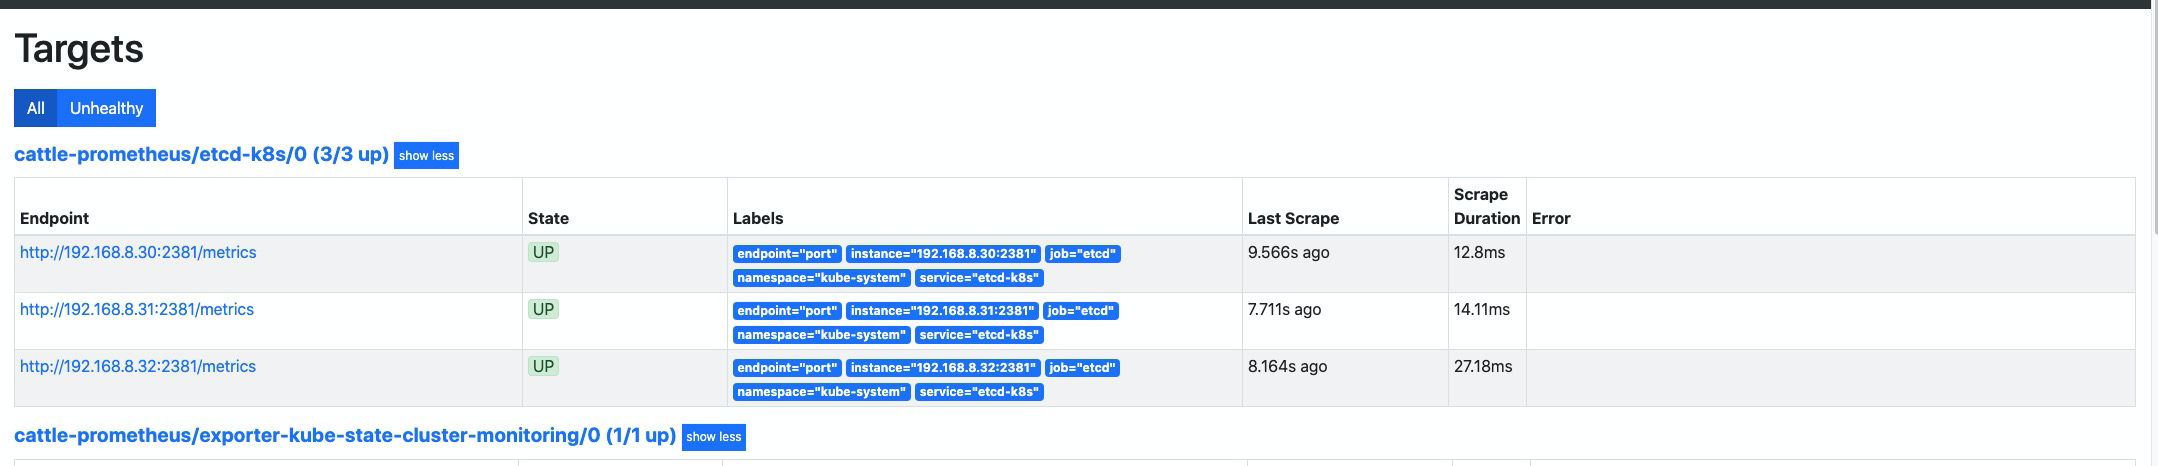
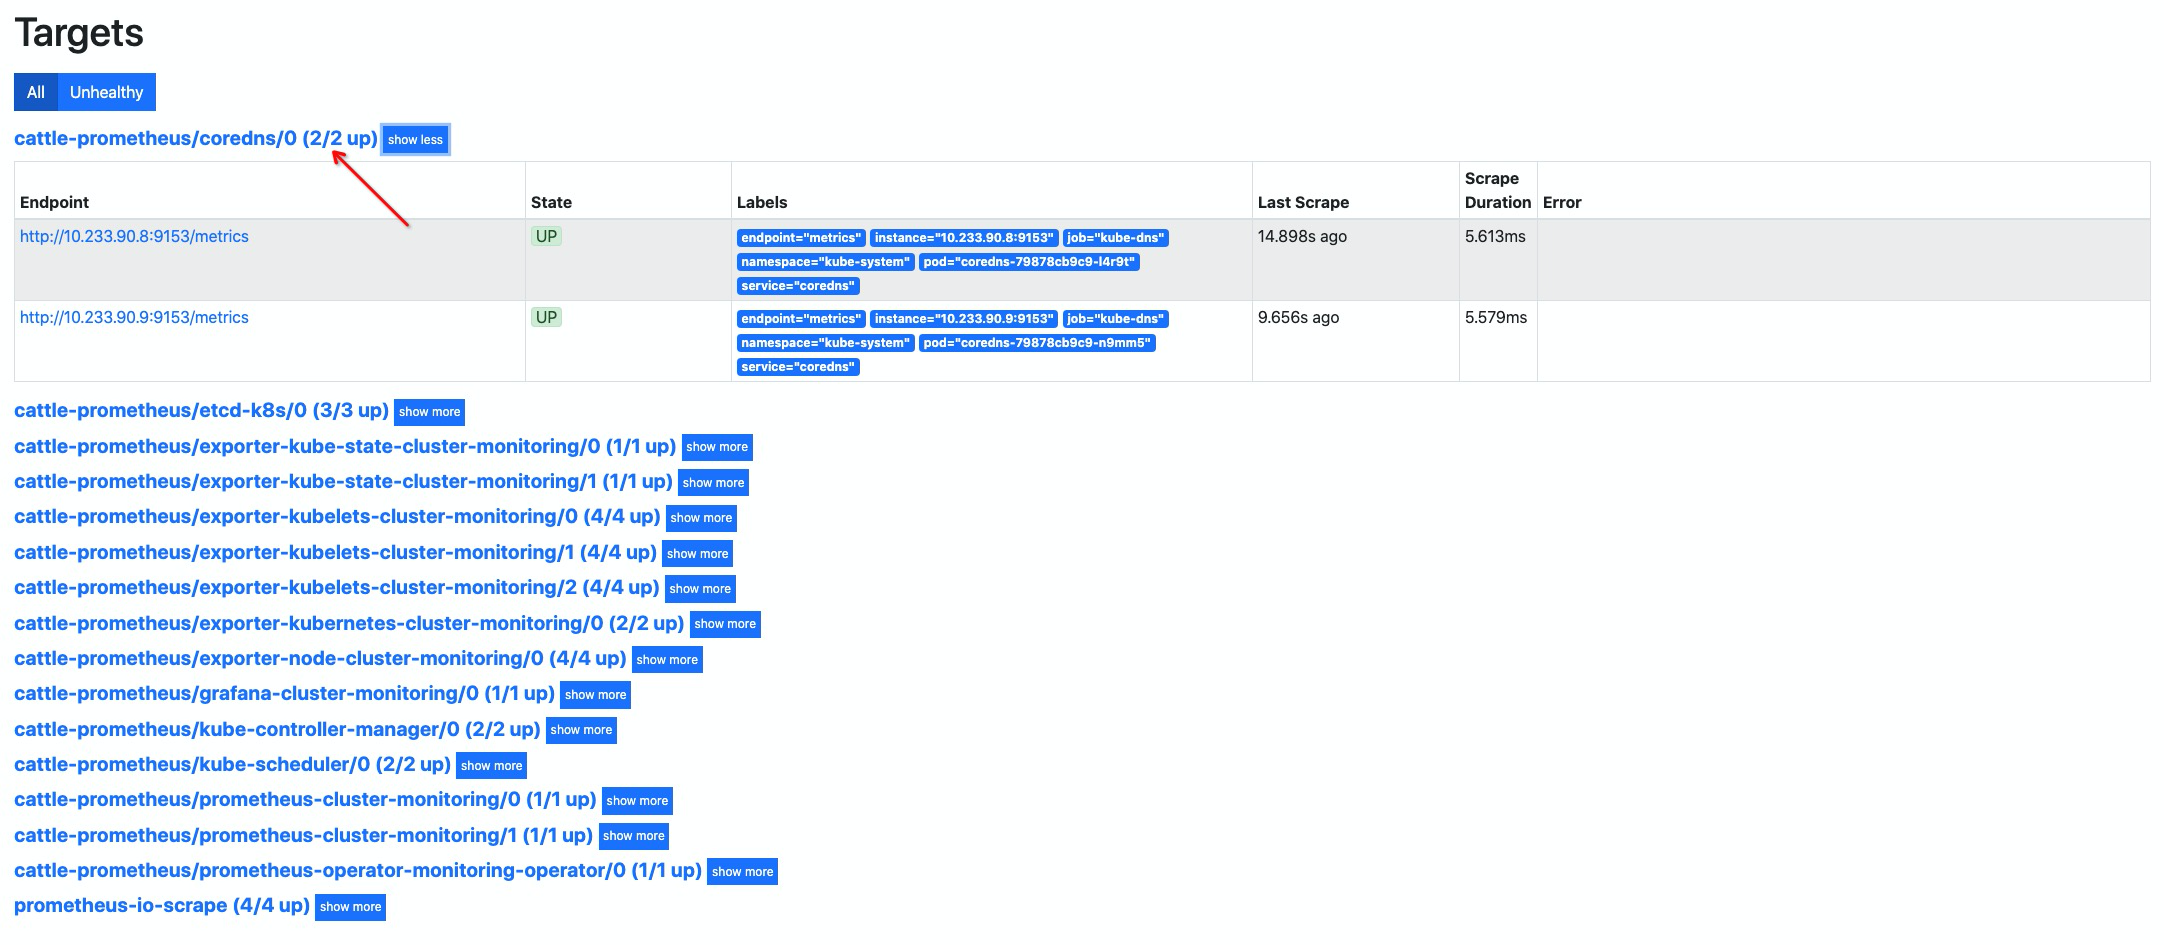
再次刷新查看,指标已正常显示抓取。
添加 controller-manager 指标抓取#
添加 controller-manager service 资源对象
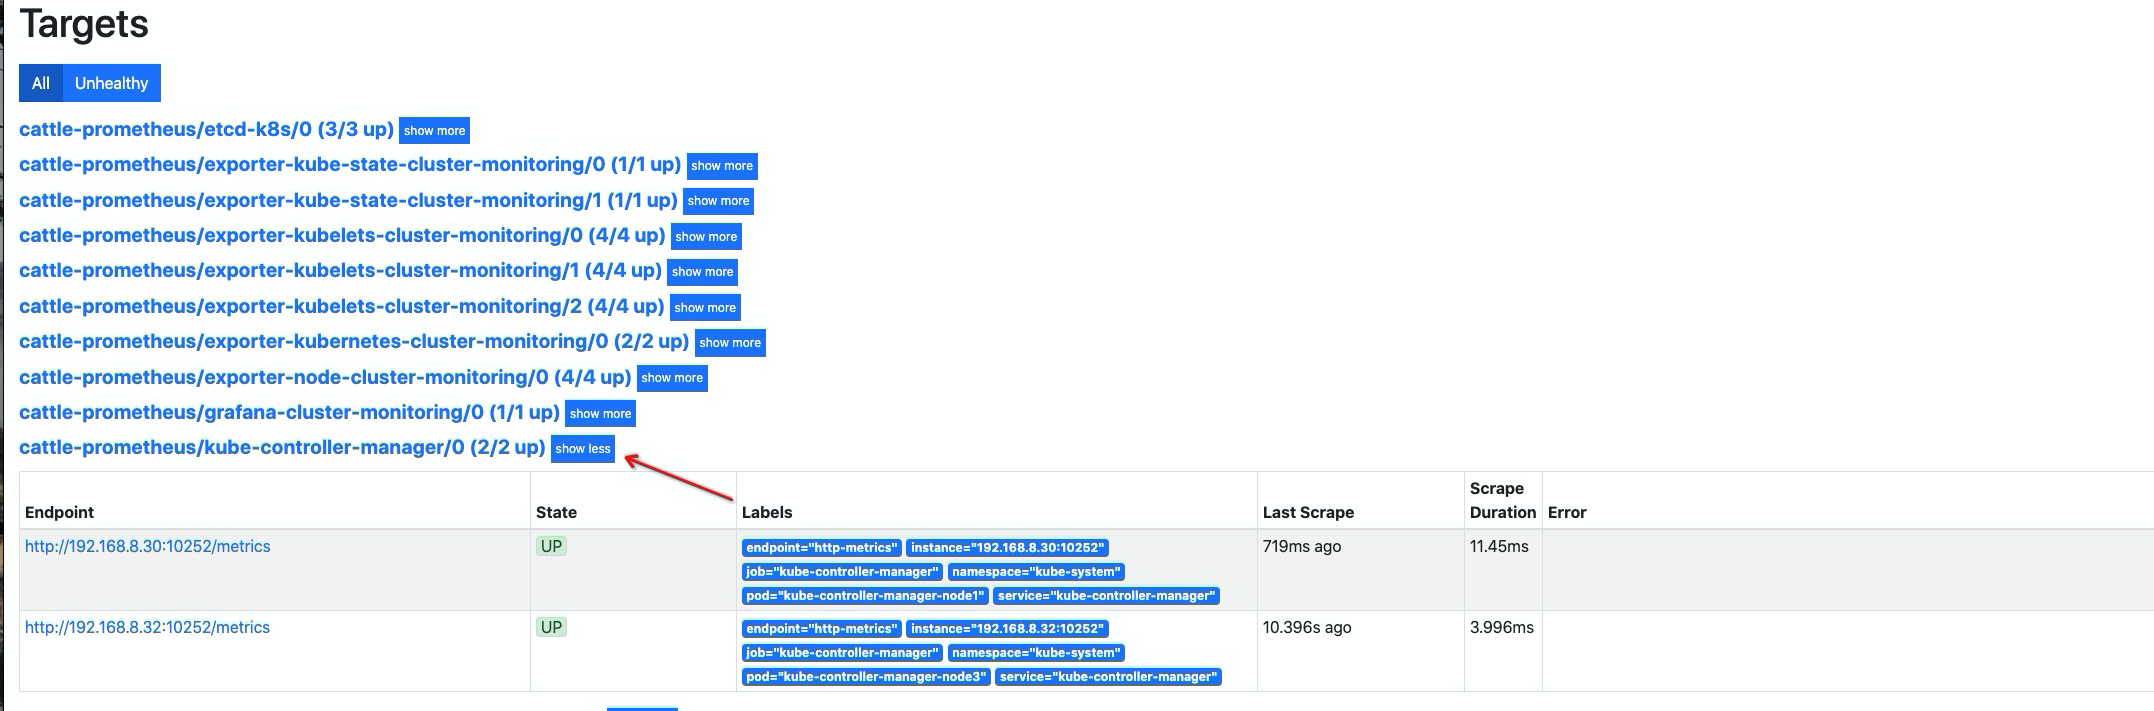
cat << EOF | kubectl apply -f -
apiVersion: v1
kind: Service
metadata:
  namespace: kube-system
  name: kube-controller-manager
  labels:
    k8s-app: kube-controller-manager
spec:
  selector:
    component: kube-controller-manager  # 这里标签,一定需要后后面的 pod 进行对应上
  ports:
  - name: http-metrics
    port: 10252
    targetPort: 10252
EOF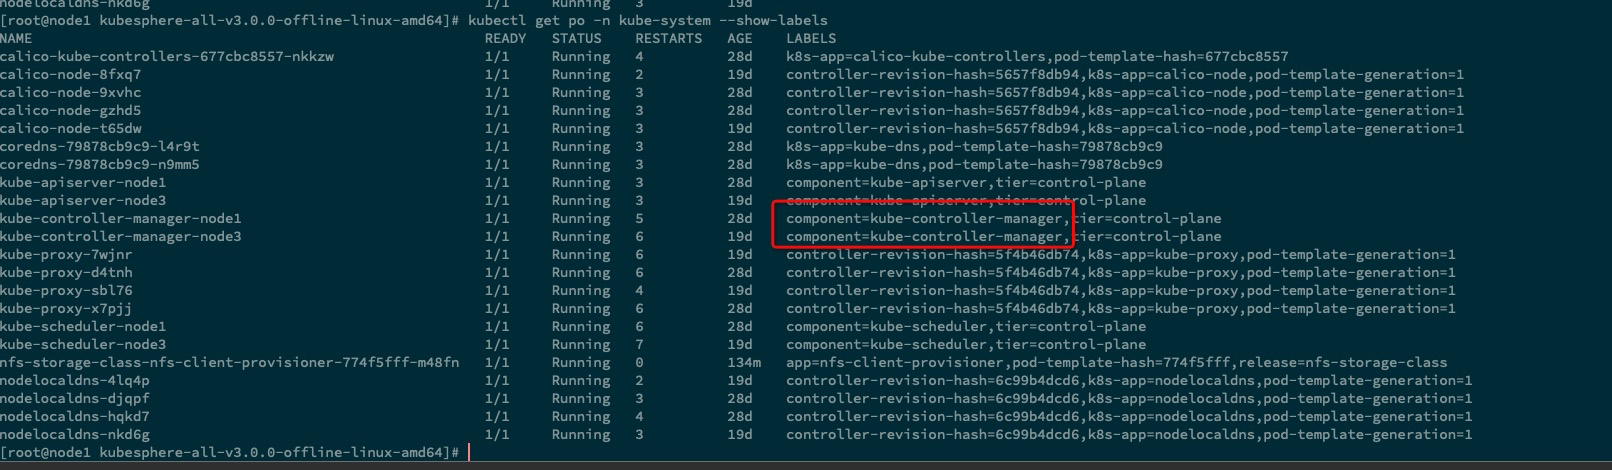
创建 controller-manager
ServiceMonitor资源对象cat << EOF | kubectl apply -f - apiVersion: monitoring.coreos.com/v1 kind: ServiceMonitor metadata: labels: k8s-app: kube-controller-manager name: kube-controller-manager namespace: cattle-prometheus spec: endpoints: - interval: 30s metricRelabelings: - action: drop regex: kubelet_(pod_worker_latency_microseconds|pod_start_latency_microseconds|cgroup_manager_latency_microseconds|pod_worker_start_latency_microseconds|pleg_relist_latency_microseconds|pleg_relist_interval_microseconds|runtime_operations|runtime_operations_latency_microseconds|runtime_operations_errors|eviction_stats_age_microseconds|device_plugin_registration_count|device_plugin_alloc_latency_microseconds|network_plugin_operations_latency_microseconds) sourceLabels: - __name__ - action: drop regex: scheduler_(e2e_scheduling_latency_microseconds|scheduling_algorithm_predicate_evaluation|scheduling_algorithm_priority_evaluation|scheduling_algorithm_preemption_evaluation|scheduling_algorithm_latency_microseconds|binding_latency_microseconds|scheduling_latency_seconds) sourceLabels: - __name__ - action: drop regex: apiserver_(request_count|request_latencies|request_latencies_summary|dropped_requests|storage_data_key_generation_latencies_microseconds|storage_transformation_failures_total|storage_transformation_latencies_microseconds|proxy_tunnel_sync_latency_secs) sourceLabels: - __name__ - action: drop regex: kubelet_docker_(operations|operations_latency_microseconds|operations_errors|operations_timeout) sourceLabels: - __name__ - action: drop regex: reflector_(items_per_list|items_per_watch|list_duration_seconds|lists_total|short_watches_total|watch_duration_seconds|watches_total) sourceLabels: - __name__ - action: drop regex: etcd_(helper_cache_hit_count|helper_cache_miss_count|helper_cache_entry_count|request_cache_get_latencies_summary|request_cache_add_latencies_summary|request_latencies_summary) sourceLabels: - __name__ - action: drop regex: transformation_(transformation_latencies_microseconds|failures_total) sourceLabels: - __name__ - action: drop regex: (admission_quota_controller_adds|crd_autoregistration_controller_work_duration|APIServiceOpenAPIAggregationControllerQueue1_adds|AvailableConditionController_retries|crd_openapi_controller_unfinished_work_seconds|APIServiceRegistrationController_retries|admission_quota_controller_longest_running_processor_microseconds|crdEstablishing_longest_running_processor_microseconds|crdEstablishing_unfinished_work_seconds|crd_openapi_controller_adds|crd_autoregistration_controller_retries|crd_finalizer_queue_latency|AvailableConditionController_work_duration|non_structural_schema_condition_controller_depth|crd_autoregistration_controller_unfinished_work_seconds|AvailableConditionController_adds|DiscoveryController_longest_running_processor_microseconds|autoregister_queue_latency|crd_autoregistration_controller_adds|non_structural_schema_condition_controller_work_duration|APIServiceRegistrationController_adds|crd_finalizer_work_duration|crd_naming_condition_controller_unfinished_work_seconds|crd_openapi_controller_longest_running_processor_microseconds|DiscoveryController_adds|crd_autoregistration_controller_longest_running_processor_microseconds|autoregister_unfinished_work_seconds|crd_naming_condition_controller_queue_latency|crd_naming_condition_controller_retries|non_structural_schema_condition_controller_queue_latency|crd_naming_condition_controller_depth|AvailableConditionController_longest_running_processor_microseconds|crdEstablishing_depth|crd_finalizer_longest_running_processor_microseconds|crd_naming_condition_controller_adds|APIServiceOpenAPIAggregationControllerQueue1_longest_running_processor_microseconds|DiscoveryController_queue_latency|DiscoveryController_unfinished_work_seconds|crd_openapi_controller_depth|APIServiceOpenAPIAggregationControllerQueue1_queue_latency|APIServiceOpenAPIAggregationControllerQueue1_unfinished_work_seconds|DiscoveryController_work_duration|autoregister_adds|crd_autoregistration_controller_queue_latency|crd_finalizer_retries|AvailableConditionController_unfinished_work_seconds|autoregister_longest_running_processor_microseconds|non_structural_schema_condition_controller_unfinished_work_seconds|APIServiceOpenAPIAggregationControllerQueue1_depth|AvailableConditionController_depth|DiscoveryController_retries|admission_quota_controller_depth|crdEstablishing_adds|APIServiceOpenAPIAggregationControllerQueue1_retries|crdEstablishing_queue_latency|non_structural_schema_condition_controller_longest_running_processor_microseconds|autoregister_work_duration|crd_openapi_controller_retries|APIServiceRegistrationController_work_duration|crdEstablishing_work_duration|crd_finalizer_adds|crd_finalizer_depth|crd_openapi_controller_queue_latency|APIServiceOpenAPIAggregationControllerQueue1_work_duration|APIServiceRegistrationController_queue_latency|crd_autoregistration_controller_depth|AvailableConditionController_queue_latency|admission_quota_controller_queue_latency|crd_naming_condition_controller_work_duration|crd_openapi_controller_work_duration|DiscoveryController_depth|crd_naming_condition_controller_longest_running_processor_microseconds|APIServiceRegistrationController_depth|APIServiceRegistrationController_longest_running_processor_microseconds|crd_finalizer_unfinished_work_seconds|crdEstablishing_retries|admission_quota_controller_unfinished_work_seconds|non_structural_schema_condition_controller_adds|APIServiceRegistrationController_unfinished_work_seconds|admission_quota_controller_work_duration|autoregister_depth|autoregister_retries|kubeproxy_sync_proxy_rules_latency_microseconds|rest_client_request_latency_seconds|non_structural_schema_condition_controller_retries) sourceLabels: - __name__ - action: drop regex: etcd_(debugging|disk|request|server).* sourceLabels: - __name__ port: http-metrics jobLabel: k8s-app namespaceSelector: matchNames: - kube-system selector: matchLabels: k8s-app: kube-controller-manager # 这里需要与 service 的标签进行对应 EOF
添加 scheduler 指标抓取#
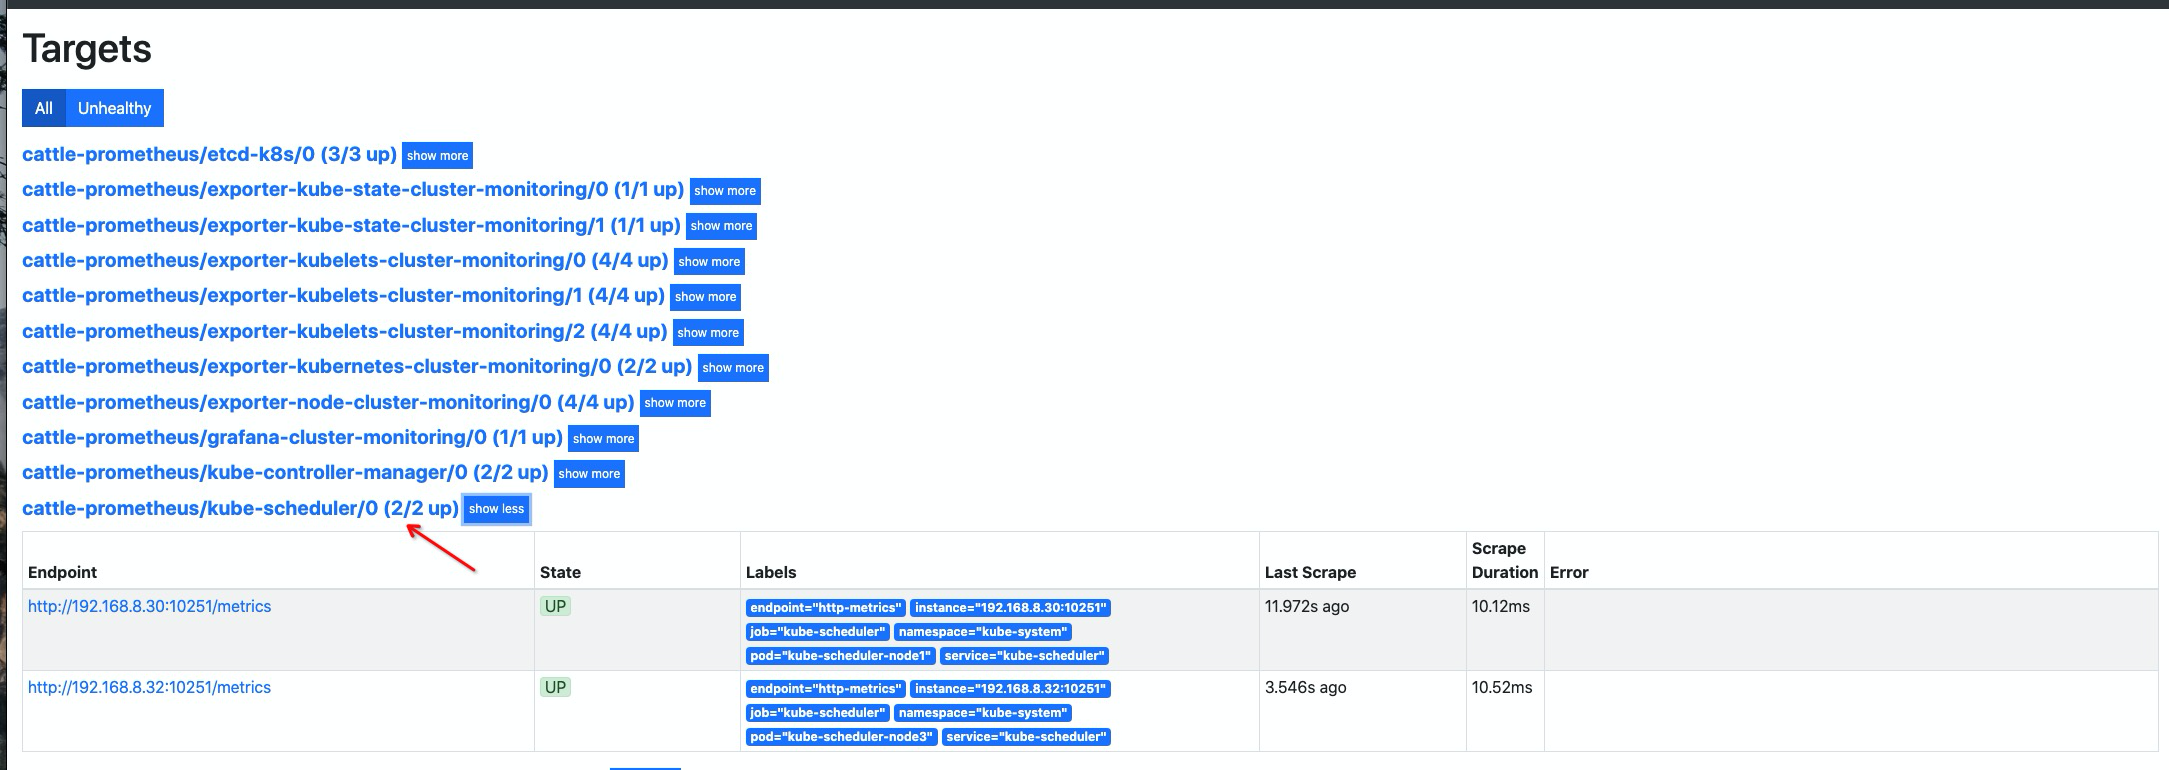
添加 scheduler service 资源对象
cat << EOF | kubectl apply -f -
apiVersion: v1
kind: Service
metadata:
  namespace: kube-system
  name: kube-scheduler
  labels:
    k8s-app: kube-scheduler
spec:
  selector:
    component: kube-scheduler  # 同上指标需要与 pod 标签进行对应
  ports:
  - name: http-metrics
    port: 10251
    targetPort: 10251
EOF
创建 scheduler
ServiceMonitor资源对象cat << EOF | kubectl apply -f - apiVersion: monitoring.coreos.com/v1 kind: ServiceMonitor metadata: labels: k8s-app: kube-scheduler name: kube-scheduler namespace: cattle-prometheus spec: endpoints: - interval: 30s port: http-metrics jobLabel: k8s-app namespaceSelector: matchNames: - kube-system selector: matchLabels: k8s-app: kube-scheduler EOF
添加 coredns 指标抓取#
默认 coredns 的 service 资源对象已被创建,只需要创建
ServiceMonitor对象即可
创建 ServiceMonitor 资源对象
cat << EOF | kubectl apply -f -
apiVersion: monitoring.coreos.com/v1
kind: ServiceMonitor
metadata:
  labels:
    k8s-app: coredns
  name: coredns
  namespace: cattle-prometheus
spec:
  endpoints:
  - bearerTokenFile: /var/run/secrets/kubernetes.io/serviceaccount/token
    interval: 15s
    port: metrics
  jobLabel: k8s-app
  namespaceSelector:
    matchNames:
    - kube-system
  selector:
    matchLabels:
      k8s-app: kube-dns
EOF
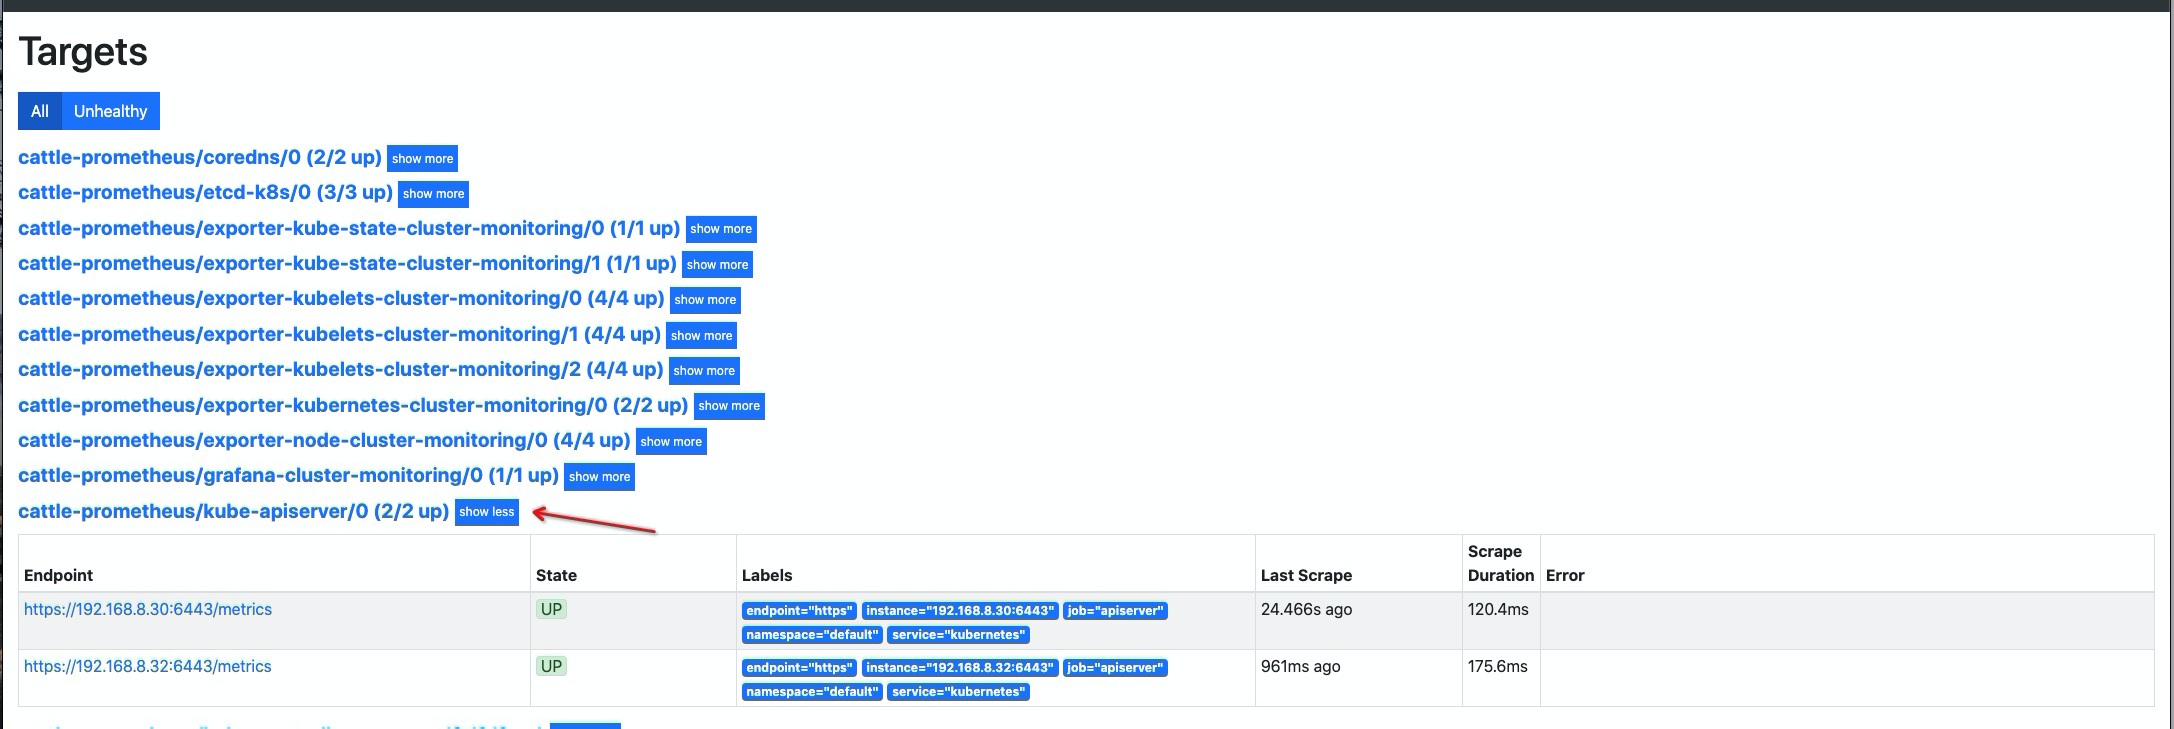
添加 apiserver 指标抓取#
检查 apiserver service 资源对象

创建 apiserver
ServiceMonitor资源对象cat << EOF | kubectl apply -f - apiVersion: monitoring.coreos.com/v1 kind: ServiceMonitor metadata: labels: k8s-app: apiserver name: kube-apiserver namespace: cattle-prometheus spec: endpoints: - bearerTokenFile: /var/run/secrets/kubernetes.io/serviceaccount/token interval: 30s metricRelabelings: - action: drop regex: kubelet_(pod_worker_latency_microseconds|pod_start_latency_microseconds|cgroup_manager_latency_microseconds|pod_worker_start_latency_microseconds|pleg_relist_latency_microseconds|pleg_relist_interval_microseconds|runtime_operations|runtime_operations_latency_microseconds|runtime_operations_errors|eviction_stats_age_microseconds|device_plugin_registration_count|device_plugin_alloc_latency_microseconds|network_plugin_operations_latency_microseconds) sourceLabels: - __name__ - action: drop regex: scheduler_(e2e_scheduling_latency_microseconds|scheduling_algorithm_predicate_evaluation|scheduling_algorithm_priority_evaluation|scheduling_algorithm_preemption_evaluation|scheduling_algorithm_latency_microseconds|binding_latency_microseconds|scheduling_latency_seconds) sourceLabels: - __name__ - action: drop regex: apiserver_(request_count|request_latencies|request_latencies_summary|dropped_requests|storage_data_key_generation_latencies_microseconds|storage_transformation_failures_total|storage_transformation_latencies_microseconds|proxy_tunnel_sync_latency_secs) sourceLabels: - __name__ - action: drop regex: kubelet_docker_(operations|operations_latency_microseconds|operations_errors|operations_timeout) sourceLabels: - __name__ - action: drop regex: reflector_(items_per_list|items_per_watch|list_duration_seconds|lists_total|short_watches_total|watch_duration_seconds|watches_total) sourceLabels: - __name__ - action: drop regex: etcd_(helper_cache_hit_count|helper_cache_miss_count|helper_cache_entry_count|request_cache_get_latencies_summary|request_cache_add_latencies_summary|request_latencies_summary) sourceLabels: - __name__ - action: drop regex: transformation_(transformation_latencies_microseconds|failures_total) sourceLabels: - __name__ - action: drop regex: (admission_quota_controller_adds|crd_autoregistration_controller_work_duration|APIServiceOpenAPIAggregationControllerQueue1_adds|AvailableConditionController_retries|crd_openapi_controller_unfinished_work_seconds|APIServiceRegistrationController_retries|admission_quota_controller_longest_running_processor_microseconds|crdEstablishing_longest_running_processor_microseconds|crdEstablishing_unfinished_work_seconds|crd_openapi_controller_adds|crd_autoregistration_controller_retries|crd_finalizer_queue_latency|AvailableConditionController_work_duration|non_structural_schema_condition_controller_depth|crd_autoregistration_controller_unfinished_work_seconds|AvailableConditionController_adds|DiscoveryController_longest_running_processor_microseconds|autoregister_queue_latency|crd_autoregistration_controller_adds|non_structural_schema_condition_controller_work_duration|APIServiceRegistrationController_adds|crd_finalizer_work_duration|crd_naming_condition_controller_unfinished_work_seconds|crd_openapi_controller_longest_running_processor_microseconds|DiscoveryController_adds|crd_autoregistration_controller_longest_running_processor_microseconds|autoregister_unfinished_work_seconds|crd_naming_condition_controller_queue_latency|crd_naming_condition_controller_retries|non_structural_schema_condition_controller_queue_latency|crd_naming_condition_controller_depth|AvailableConditionController_longest_running_processor_microseconds|crdEstablishing_depth|crd_finalizer_longest_running_processor_microseconds|crd_naming_condition_controller_adds|APIServiceOpenAPIAggregationControllerQueue1_longest_running_processor_microseconds|DiscoveryController_queue_latency|DiscoveryController_unfinished_work_seconds|crd_openapi_controller_depth|APIServiceOpenAPIAggregationControllerQueue1_queue_latency|APIServiceOpenAPIAggregationControllerQueue1_unfinished_work_seconds|DiscoveryController_work_duration|autoregister_adds|crd_autoregistration_controller_queue_latency|crd_finalizer_retries|AvailableConditionController_unfinished_work_seconds|autoregister_longest_running_processor_microseconds|non_structural_schema_condition_controller_unfinished_work_seconds|APIServiceOpenAPIAggregationControllerQueue1_depth|AvailableConditionController_depth|DiscoveryController_retries|admission_quota_controller_depth|crdEstablishing_adds|APIServiceOpenAPIAggregationControllerQueue1_retries|crdEstablishing_queue_latency|non_structural_schema_condition_controller_longest_running_processor_microseconds|autoregister_work_duration|crd_openapi_controller_retries|APIServiceRegistrationController_work_duration|crdEstablishing_work_duration|crd_finalizer_adds|crd_finalizer_depth|crd_openapi_controller_queue_latency|APIServiceOpenAPIAggregationControllerQueue1_work_duration|APIServiceRegistrationController_queue_latency|crd_autoregistration_controller_depth|AvailableConditionController_queue_latency|admission_quota_controller_queue_latency|crd_naming_condition_controller_work_duration|crd_openapi_controller_work_duration|DiscoveryController_depth|crd_naming_condition_controller_longest_running_processor_microseconds|APIServiceRegistrationController_depth|APIServiceRegistrationController_longest_running_processor_microseconds|crd_finalizer_unfinished_work_seconds|crdEstablishing_retries|admission_quota_controller_unfinished_work_seconds|non_structural_schema_condition_controller_adds|APIServiceRegistrationController_unfinished_work_seconds|admission_quota_controller_work_duration|autoregister_depth|autoregister_retries|kubeproxy_sync_proxy_rules_latency_microseconds|rest_client_request_latency_seconds|non_structural_schema_condition_controller_retries) sourceLabels: - __name__ - action: drop regex: etcd_(debugging|disk|request|server).* sourceLabels: - __name__ - action: drop regex: apiserver_admission_controller_admission_latencies_seconds_.* sourceLabels: - __name__ - action: drop regex: apiserver_admission_step_admission_latencies_seconds_.* sourceLabels: - __name__ - action: drop regex: apiserver_request_duration_seconds_bucket;(0.15|0.25|0.3|0.35|0.4|0.45|0.6|0.7|0.8|0.9|1.25|1.5|1.75|2.5|3|3.5|4.5|6|7|8|9|15|25|30|50) sourceLabels: - __name__ - le port: https scheme: https tlsConfig: caFile: /var/run/secrets/kubernetes.io/serviceaccount/ca.crt serverName: kubernetes jobLabel: component namespaceSelector: matchNames: - default selector: matchLabels: component: apiserver # 与上面查询到的 labels 进行匹配 provider: kubernetes EOF
总结#
基础的指标抓取 和 基础优化就完成了,如后续需要添加指标,参照上面的添加 抓取指标步骤
照葫芦画瓢,创建ServiceMonitor资源对象即可,当然还有另外一种添加配置的方法,后面与 exporter 集成使用时会做使用说明。