- 博客/
Centos 单机部署 Prometheus
作者
Johny
熟练的 云原生搬砖师
Table of Contents
此文档为归档文件,不保证有效,且供参考
环境说明#
- 操作系统: CentOS Linux release 7.9.2009 (Core)
- Prometheus Version: 2.25.0
Prometheus#
软件包下载#
wget https://github.com/prometheus/prometheus/releases/download/v2.25.0/prometheus-2.25.0.linux-amd64.tar.gz
tar xf prometheus-2.25.0.linux-amd64.tar.gz
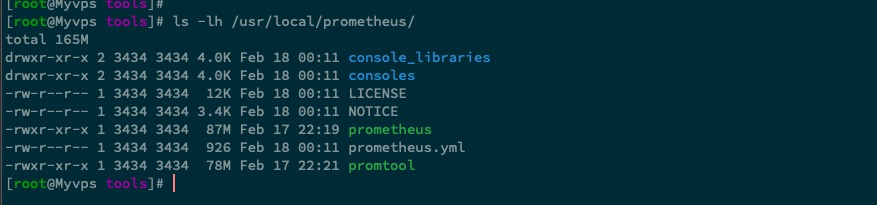
mkdir -p /usr/local/prometheus
cp -a prometheus-2.25.0.linux-amd64/* /usr/local/prometheus # 复制文件到,刚才创建的文件夹下
设置至环境变量内#
vim /etc/profile
export PATH=/usr/local/prometheus:$PATH   # 添加到 PATH 变量中

source /etc/profile

[root@Myvps ~]# prometheus --version
prometheus, version 2.25.0 (branch: HEAD, revision: a6be548dbc17780d562a39c0e4bd0bd4c00ad6e2)
  build user:       root@615f028225c9
  build date:       20210217-14:17:24
  go version:       go1.15.8
  platform:         linux/amd64
添加为服务启动#
groupadd -r prometheus && useradd -r -g prometheus -s /sbin/nologin -M prometheus   # 添加 prometheus 专属运行用户

chown -R prometheus:prometheus /usr/local/prometheus/  # 权限赋予给专属用户

touch /usr/lib/systemd/system/prometheus.service \
&& chown prometheus:prometheus /usr/lib/systemd/system/prometheus.service  # 创建服务启动文件


mkdir -p /etc/prometheus/ /var/lib/prometheus

cp -a /usr/local/prometheus/console_libraries/ /usr/local/prometheus/consoles/ /usr/local/prometheus/prometheus.yml  /etc/prometheus/  # copy 配置文件到 配置文件路径下

/usr/local/prometheus/prometheus \
--config.file=/etc/prometheus/prometheus.yml \
--storage.tsdb.path=/var/lib/prometheus \
--web.external-url="http://prometheus.treesir.pub:1800/prometheus" \
--storage.tsdb.retention.time=168h \
--web.enable-lifecycle \
--storage.tsdb.no-lockfile \
--web.route-prefix="/prometheus" \
--web.listen-address="0.0.0.0:19091" \
--web.console.templates=/etc/prometheus/consoles \
--web.console.libraries=/etc/prometheus/console_libraries   # 测试启动
上面示例中,prometheus 监听在 127.0.0.1:9091 之上,外部无法访问 127.0.0.1 地址,且默认 Prometheus 为做任何加密处理。这里演示使用
nginx虚拟主机配置代理功能&用户密码实现访问,其他还有很多工具可以实现,这里不多赘述,可以自行 百度 搜索。yum install httpd-tools -y htpasswd -c /etc/prometheus/.auth admin # 交互式创建 admin 账号和密码 vim /usr/local/nginx/conf/vhost/prometheus.conf # nginx 添加 prometheus.conf 虚拟主机配置文件,类容如下所示。 server { listen 1800; server_name prometheus.treesir.pub; charset utf-8; location / { auth_basic "Prometheus"; auth_basic_user_file /etc/prometheus/.auth; proxy_pass http://127.0.0.1:9091; } } [root@Myvps ~]# nginx -t nginx: the configuration file /usr/local/nginx/conf/nginx.conf syntax is ok nginx: configuration file /usr/local/nginx/conf/nginx.conf test is successful [root@Myvps ~]# nginx -s reload # 重载配置
添加至systemctl 服务
chown prometheus:prometheus -R /var/lib/prometheus/

cat > /usr/lib/systemd/system/prometheus.service << EOF
[Unit]
Description=Prometheus
Documentation=https://prometheus.io/
After=network.target

[Service]
Type=simple
User=prometheus
ExecStart=/usr/local/prometheus/prometheus \
--config.file=/etc/prometheus/prometheus.yml \
--storage.tsdb.path=/var/lib/prometheus \
--web.external-url=http://prometheus.treesir.pub:1800/prometheus \
--storage.tsdb.retention.time=168h \
--web.enable-lifecycle \
--storage.tsdb.no-lockfile \
--web.route-prefix=/prometheus \
--web.listen-address=0.0.0.0:19091 \
--web.console.templates=/etc/prometheus/consoles \
--web.console.libraries=/etc/prometheus/console_libraries
Restart=on-failure

[Install]
WantedBy=multi-user.target
EOF

systemctl start prometheus && systemctl enable prometheus && systemctl status prometheus
删除不必要的标签 参考配置#
  - job_name: 'docker'
    static_configs:
      - targets: ['192.168.20.172:8080', '192.168.20.173:8080', '192.168.20.174:8080']
    metric_relabel_configs:
      - source_labels: [__name__]
        separator: ','
        regex: '(container_tasks_state|container_memory_failures_total)'
        action: drop
AlertManager 安装部署#
 #下载地址: https://prometheus.io/download/
wget https://github.com/prometheus/alertmanager/releases/download/v0.17.0/alertmanager-0.17.0.linux-amd64.tar.gz
tar xf alertmanager-0.17.0.linux-amd64.tar.gz
sudo firewall-cmd --zone=public --add-port=9093/tcp --permanent
sudo firewall-cmd --zone=public --add-port=9093/udp --permanent
sudo firewall-cmd --reload

cp alertmanager/{alertmanager,amtool} /usr/local/bin/
mkdir /etc/alertmanager/
cat > /etc/alertmanager/alertmanager.yml << EOF
global:
  smtp_smarthost: 'smtp.163.com'
  smtp_from: 'csheidou@163.com'
  smtp_auth_username: 'csheidou@163.com'
  smtp_auth_password: 'xxxx'
  smtp_require_tls: false

route:
  receiver: 'mail'

receivers:
- name: 'mail'
  email_configs:
  - to: '522181549@qq.com'
EOF
Alertmanager 启动
nohup alertmanager --config.file=/etc/alertmanager/alertmanager.yml --web.external-url=http://hdkj.alertmanager.com >/tmp/alertmanager.log 2>&1 & #启动添加为服务自启动
 cat  > /usr/lib/systemd/system/alertmanager.service <<EOF
[Unit]
Description=alertmanager
Documentation=https://github.com/prometheus/alertmanager
After=network.target

[Service]
Type=simple
User=root
ExecStart=/usr/local/bin/php-fpm-exporter --addr 0.0.0.0:9190 --endpoint http://127.0.0.1:9010/status
Restart=on-failure

[Install]
WantedBy=multi-user.target
EOF
prometheus dingtalk webhook
 wget https://github.com/timonwong/prometheus-webhook-dingtalk/releases/download/v1.4.0/prometheus-webhook-dingtalk-1.4.0.linux-amd64.tar.gz

 mv prometheus-webhook-dingtalk-1.4.0.linux-amd64 /usr/local/webhook-dingtalk

 cat /etc/profile
 export PATH=/usr/local/webhook-dingtalk:$PATH  # 添加到环境变量至 /etc/profile 中永久生效

mkdir -p /etc/webhook-dingtalk
cp /usr/local/webhook-dingtalk/config.example.yml /etc/webhook-dingtalk/config.yml # 添加配置文件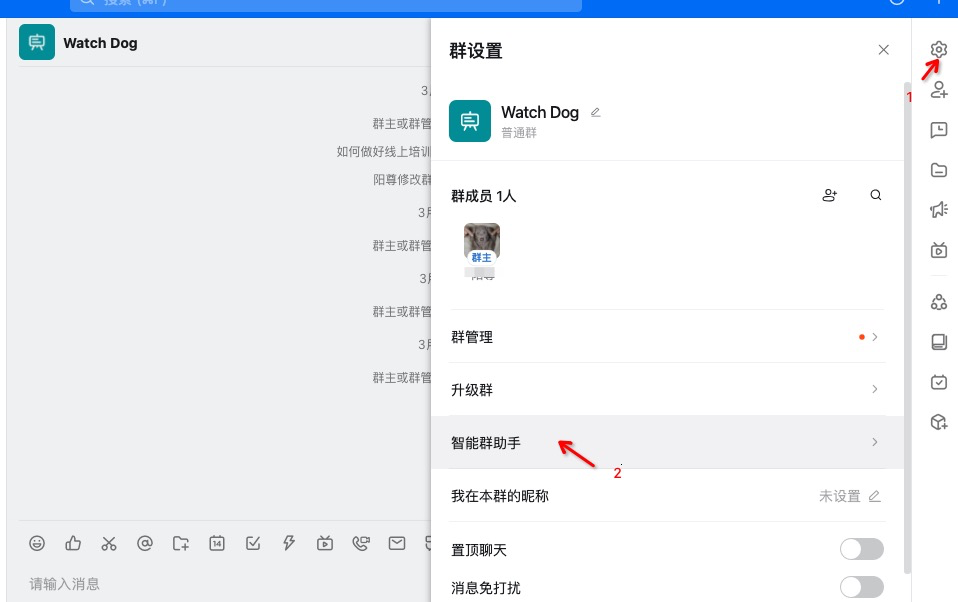
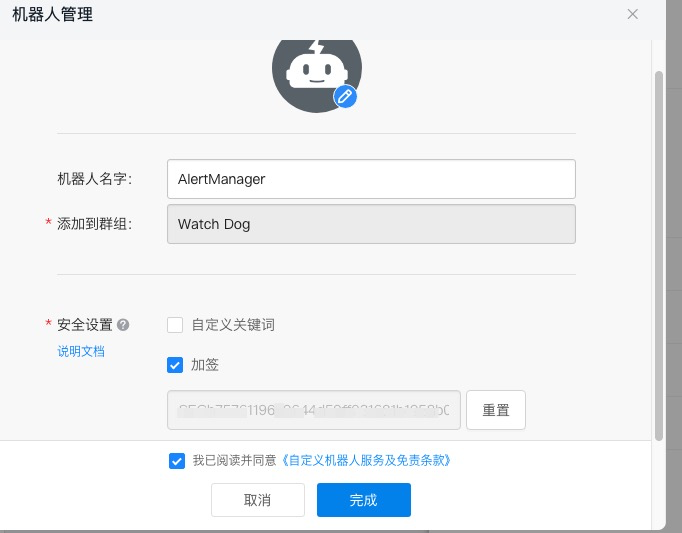
添加自定义机器人, 选择密钥加签
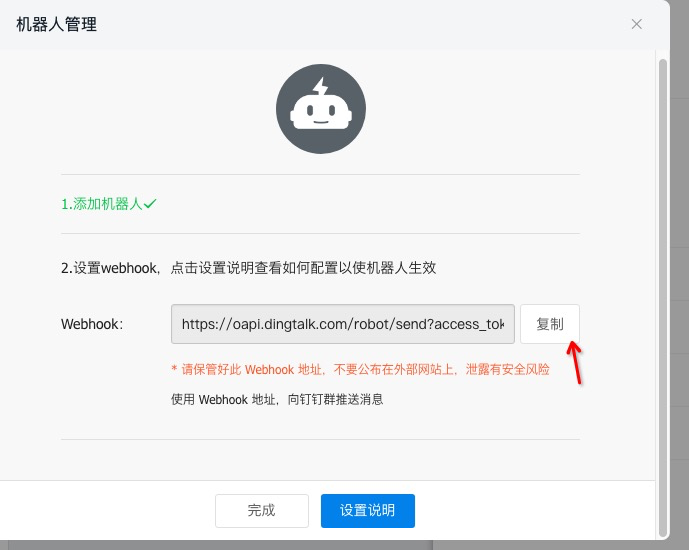
将默认配置文件中的,token 替换为刚才生成的 token,如配置了密钥加签还需要将 加签密钥,添加到 secret: 自动中
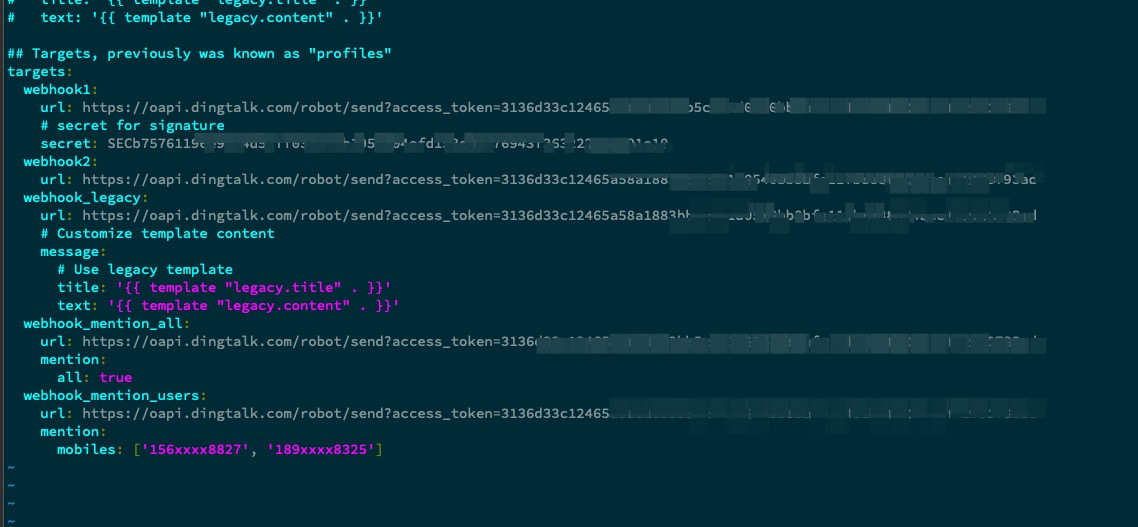
sed -i "s#xxxxxxxxxxxx#3136d33c12465a58a1#g" /etc/webhook-dingtalk/config.yml
测试启动
prometheus-webhook-dingtalk \
--web.listen-address="127.0.0.1:8060" \
--web.enable-ui \
--config.file=/etc/webhook-dingtalk/config.yml \
--log.level=info \
--log.format=json

curl http://localhost:8060/dingtalk/webhook1/send \
-H 'Content-Type: application/json' \
-d '{"msgtype": "text",
"text": {
"content": "我就是我, 是不一样的烟火"
}
}'

可以看的,发送消息成功了,只是我们发送的消息 和 alert 模板里面的值不匹配,导致渲染消息没有成功。
webhook-dingtalk 配置为服务自启动
 cat  > /usr/lib/systemd/system/webhook-dingtalk.service <<EOF
[Unit]
Description=webhook-dingtalk
Documentation=https://github.com/timonwong/prometheus-webhook-dingtalk
After=network.target

[Service]
Type=simple
User=root
ExecStart=/usr/local/webhook-dingtalk/prometheus-webhook-dingtalk \
--web.listen-address=127.0.0.1:8060 \
--config.file=/etc/webhook-dingtalk/config.yml \
--log.level=info \
--log.format=json

Restart=on-failure

[Install]
WantedBy=multi-user.target
EOF

systemctl enable  webhook-dingtalk.service
systemctl start webhook-dingtalk.service
systemctl status webhook-dingtalk.service
dingtalk
cat > /etc/alertmanager/alertmanager.yml << EOF
global:
  resolve_timeout: 5m
route:
  receiver: webhook
  group_wait: 30s
  group_interval: 5m
  repeat_interval: 4h
  group_by: [alertname]
  routes:
  - receiver: webhook
    group_wait: 10s
    match:
      team: node
receivers:
- name: webhook
  webhook_configs:
  - url: http://127.0.0.1:8060/dingtalk/webhook1/send
    send_resolved: true
EOF
alertmange 配置服务自启动
alertmanager \
--config.file=/etc/alertmanager/alertmanager.yml \
--web.external-url=http://alertmanager.treesir.pub \
--web.listen-address="127.0.0.1:9093"
# 测试启动


cat  > /usr/lib/systemd/system/alertmanager.service <<EOF
[Unit]
Description=alertmanager
Documentation=https://github.com/prometheus/alertmanager
After=network.target

[Service]
Type=simple
User=root
ExecStart=/usr/local/alertmanager/alertmanager \
--config.file=/etc/alertmanager/alertmanager.yml \
--web.external-url=http://alertmanager.treesir.pub \
--web.listen-address=127.0.0.1:9093

Restart=on-failure

[Install]
WantedBy=multi-user.target
EOF

systemctl enable  alertmanager.service
systemctl start alertmanager.service
systemctl status alertmanager.service
配置linux _node_exporter#
node_exporter --collector.textfile.directory /var/lib/node_exporter/textfile_collector --collector.systemd --collector.systemd.unit-whitelist="(docker|sshd|rsyslog).service" --web.listen-address="0.0.0.0:9600" --web.telemetry-path="/node_metrics" &

node_exporter --web.listen-address="0.0.0.0:9600" &   #指定端口启动


nohup node_exporter --collector.textfile.directory /var/lib/node_exporter/textfile_collector --collector.systemd --collector.systemd.unit-whitelist="(docker|sshd|rsyslog).service" > /tmp/node_exporter.out 2>&1 &          # 监控服务是否运行


node_systemd_unit_state{name="docker.service"}   ## 只查询 docker服务

node_systemd_unit_state{name="docker.service",state="active"}  #返回活动状态

node_systemd_unit_state{name="docker.service"} == 1 #返回当前服务的状态

[root@localhost textfile_collector]# cat matadata.prom
metadata{role="122",datacenter="LOCAL"} 1   #自定义收集文本
[root@localhost textfile_collector]# ll /var/lib/node_exporter/textfile_collector/matadata.prom
-rw-r--r-- 1 root root 42 6月  12 21:15 /var/lib/node_exporter/textfile_collector/matadata.prom
		--collector.textfile.directory  #指定收集路径
常用公式#
promtool check config ./prometheus.yml   #检查配置文件是否有错误
100  / ((node_memory_MemTotal_bytes - (node_memory_MemFree_bytes + node_memory_Cached_bytes + node_memory_Buffers_bytes)) / node_memory_MemTotal_bytes * 10)   #内存使用计公式

100 - avg (irate (node_cpu_seconds_total{job="内网服务器122",mode="idle"}[5m])) by (instance) * 100  #计算5分钟CPU平均使用

(node_filesystem_size_bytes{mountpoint="/"} - node_filesystem_free_bytes{mountpoint="/"}) /
node_filesystem_size_bytes{mountpoint="/"} * 100  #计算根分区磁盘使用率公式
自定义数据持久查询#
cd /etc/prometheus && mkdir -p rules
#在prometheus.yml 中添加一下信息
rule_files:
  - "rules/node_alerts.yml"
cat > rules/node_alerts.yml << EOF
groups:
  - name: node_alerts
    interval: 10s
    rules:
    - record: instance:node_cpu:avg_rate5m
      expr: 100 - avg (irate (node_cpu_seconds_total{mode="idle"}[5m])) by (instance) * 100
      labels:
        metric_tyep: aggregation
    - record: instance:node_memory_usage:percentage
      expr: 100  / ((node_memory_MemTotal_bytes - (node_memory_MemFree_bytes + node_memory_Cached_bytes + node_memory_Buffers_bytes)) / node_memory_MemTotal_bytes * 10)
    - record: instance:root:node_filesystem_usage:percentage
      expr: (node_filesystem_size_bytes{mountpoint="/"} - node_filesystem_free_bytes{mountpoint="/"}) / node_filesystem_size_bytes{mountpoint="/"} * 100
EOF
/usr/sbin/lsof -n -P -t -i :9090 |xargs kill -HUP    #重启加载配置
服务发现#
基于文件
 cd /etc/prometheus
 mkdir -pv targets/{linux_nodes,docker_nodes,win_nodes}


[root@localhost prometheus]# cat prometheus.yml
global:
  scrape_interval:     15s # Set the scrape interval to every 15 seconds. Default is every 1 minute.
  evaluation_interval: 15s # Evaluate rules every 15 seconds. The default is every 1 minute.
  # scrape_timeout is set to the global default (10s).

# Alertmanager configuration
alerting:
  alertmanagers:
  - static_configs:
    - targets:
      - 192.168.8.131:9093

# Load rules once and periodically evaluate them according to the global 'evaluation_interval'.
rule_files:
  - "rules/node_alerts.yml"
  # - "second_rules.yml"

# A scrape configuration containing exactly one endpoint to scrape:
# Here it's Prometheus itself.
scrape_configs:
  - job_name: 'Prometheus'
    static_configs:
    - targets: ['192.168.8.122:9090']
      labels:
        instance: '192.168.8.122:9090'

  - job_name: 'linux_node'
    file_sd_configs:
      - files:
        - targets/linux_nodes/*.json
        refresh_interval: 1m

  - job_name: 'docker'
    file_sd_configs:
      - files:
        - targets/docker_nodes/*.json
        refresh_interval: 1m

  - job_name: 'win_node'
    file_sd_configs:
      - files:
        - targets/win_nodes/*.json
        refresh_interval: 1m

  - job_name: 'alertmanager'
    static_configs:
    - targets: ['192.168.8.131:9093']
      labels:
        instance: '192.168.8.131:9093'

[root@localhost prometheus]# cat targets/docker_nodes/docker_nodes.json
[{
   "targets": [
   "192.168.8.122:9999",
   "192.168.8.131:9999"
]
}]


[root@localhost prometheus]# cat targets/linux_nodes/linux_nodes.json
[{
  "targets": [
   "192.168.8.131:9100",
   "192.168.8.122:9100"
]
}]


[root@localhost prometheus]# cat targets/win_nodes/yangzun_node.json
[{
   "targets": [
    "192.168.8.66:9182"
]
}]

[root@localhost prometheus]# promtool check config prometheus.yml
Checking prometheus.yml
  SUCCESS: 1 rule files found

Checking rules/node_alerts.yml
  SUCCESS: 3 rules found

/usr/sbin/lsof -n -P -t -i :9090 |xargs kill -HUP


// 也可以使用下面的这种方式(YAML)
# cat /etc/prometheus/targets/nodes/demo.json
- targets:
- "192.168.20.172:8080"
- "192.168.20.173:8080"
- "192.168.20.174:8080"
alertmanager 设置钉钉告警 参考链接#
yum install go -y
mkdir -p /usr/lib/golang/src/github.com/timonwong/
git clone https://github.com/timonwong/prometheus-webhook-dingtalk.git
make
cp prometheus-webhook-dingtalk /usr/local/bin
 nohup prometheus-webhook-dingtalk --web.listen-address=":8228" --ding.profile="webhook1=https://oapi.dingtalk.com/robot/send?access_token=d4d3069d3ef12a9487ecf878b7611579d8d100e0a82516cc8e80009cbb506ebc"   2>&1 1>/tmp/dingding.log &               #安装钉钉插件并启动
配置黑盒监控#
(下载地址)[https://github.com/prometheus/blackbox_exporter]
wget https://github.com/prometheus/blackbox_exporter/releases/download/v0.14.0/blackbox_exporter-0.14.0.linux-amd64.tar.gz
tar xf blackbox_exporter-0.14.0.linux-amd64.tar.gz
mkdir /etc/exporter && cp ./blackbox_exporter-0.14.0.linux-amd64/blackbox_exporter-0.14.0.linux-amd64 /usr/local/bin/
  cp ./blackbox_exporter-0.14.0.linux-amd64/blackbox.yml /etc/exporter/blackbox.yml
nohup blackbox_exporter --config.file="/etc/exporter/blackbox.yml" --web.listen-address=":9115" --log.level=info >/tmp/blackbox.log 2>&1 &  #启动
blackbox_exporter 添加至自启动#
 cat  > /usr/lib/systemd/system/blackbox_exporter.service <<EOF
[Unit]
Description=blackbox_exporter
Documentation=https://github.com/prometheus/blackbox_exporter
After=network.target

[Service]
Type=simple
User=root
ExecStart=/usr/local/bin/blackbox_exporter --config.file=/etc/exporter/blackbox.yml --web.listen-address=192.168.8.122:9115
Restart=on-failure

[Install]
WantedBy=multi-user.target
EOF

systemctl daemon-reload && systemctl start blackbox_exporter && systemctl status blackbox_exporter   #启动

systemctl enable blackbox_exporter  #加入开机自启动
lsof -i :9115
docker 启动
mkdir -p /application/black-box-exporter/config

wget -O /application/black-box-exporter/config/blackbox.yml https://raw.githubusercontent.com/prometheus/blackbox_exporter/master/blackbox.yml

docker run -d \
-p 9115:9115 --name blackbox_exporter \
--restart always \
--net=host \
-v /application/black-box-exporter/config:/config prom/blackbox-exporter:master \
--config.file=/config/blackbox.yml \
--web.external-url=/black-box
配置php-fpm_exporter#
[root@hadoopname ~]# egrep '/ping|/status' /usr/local/php/etc/php-fpm.d/walle.conf
pm.status_path = /status
ping.path = /ping    #


[root@hadoopname ~]# cat /usr/local/nginx/conf/conf.d/
cobra.conf       jumpserver.conf  official.conf    php_status.conf  walle.conf       zabbix.conf
[root@hadoopname ~]# cat /usr/local/nginx/conf/conf.d/php_status.conf
server {
    listen 9010;
    allow 127.0.0.1;
    allow 192.168.8.0/24;
    deny all;

    location ~ ^/(status|ping)$ {
         fastcgi_pass 127.0.0.1:9000;
         fastcgi_param SCRIPT_FILENAME $document_root$fastcgi_script_name;
         include fastcgi_params;
    }
}

nohup php-fpm-exporter --addr 0.0.0.0:9190 --endpoint http://127.0.0.1:9010/status > /tmp/php-fpm-exporter.log 2>&1 &
sudo firewall-cmd --zone=public --add-port=9190/tcp --permanent
firewall-cmd --reload
添加至systemd服务 及开机自启动#
#添加开机自启动
 cat  > /usr/lib/systemd/system/php-fpm-exporter.service <<EOF
[Unit]
Description=php-fpm-exporter
Documentation=https://github.com/hipages/php-fpm_exporter
After=network.target

[Service]
Type=simple
User=root
ExecStart=/usr/local/bin/php-fpm-exporter --addr 0.0.0.0:9190 --endpoint http://127.0.0.1:9010/status
Restart=on-failure

[Install]
WantedBy=multi-user.target
EOF

systemctl daemon-reload && systemctl start php-fpm-exporter && systemctl status php-fpm-exporter
systemctl enable php-fpm-exporter
lsof -i :9090
win_exporter 安装配置#
msiexec /i wmi_exporter-0.7.0-amd64.msi ENABLED_COLLECTORS=cpu,cs,logical_disk,net,os,service,system,textfile,memory,tcp LISTEN_PORT=9010
grafana 启动
docker pull grafana/grafana:7.4.3

mkdir -p  /application/grafana/conf


docker run \
-d --rm  --name grafana  -p 3000:3000 \
grafana/grafana grafana
相关文章
Centos 7 Yum 安装 Jenkins 及常用配置的说明
·1419 字·3 分钟·
devops
jenkins
ci-cd
install
Centos7 编译安装 Qemu 及安装 libvirt 管理工具
·1061 字·3 分钟·
vm
kvm
centos7
Jira & confluence 安装 并 配置 破解激活
·1146 字·3 分钟·
devops
jira
install
confluence
VMware ESXi Clone 复制虚拟机
·190 字·1 分钟·
vm
vmware
esxi
使用 斐讯n1 & openWrt 搭建 k3s 集群
·3283 字·7 分钟·
k3s
openwrt
n1
在 Kubernetes 中部署 nfs storageClass
·1026 字·3 分钟·
devops
k8s
storage-class
nfs