- 博客/
Istio in Action 学习笔记
Table of Contents
- Istio 解决的问题
- 技术介绍
- 安装使用
- Envoy proxy
- Envoy Ingress
- 流量控制
- 恢复能力:解决应用网络挑战
- 可观察性
- 可视化
- 关于保障微服务安全
- 数据平面故障排除
- 控制平面的性能调整
- 网格融合
- 虚拟机整合并至网格
- 在请求路径上扩展 Istio
Istio 解决的问题#
基本的应用程序网络问题并非特定于任何特定的应用程序、语言或框架。重试、超时、客户端负载平衡、熔断等也不是区分应用程序功能。它们是作为服务的一部分的关键问题,但是将大量时间和资源投入到您打算使用的每种语言的特定语言实现中(包括上一节中的其他缺点)是浪费时间。我们真正想要的是一种与技术无关的方式来实现这些问题,并使应用程序不必自己这样做。
技术介绍#
Envoy:(http://envoyproxy.io) 是一种服务代理,在开源社区中作为多功能、高性能和功能强大的应用层代理出现。Envoy 是在 Lyft 开发的,是该公司 SOA 基础架构的一部分,能够实现网络问题,如重试、超时、熔断、客户端负载平衡、服务发现、安全性和指标收集,而无需任何明确的语言或框架依赖关系。
- Envoy 还捕获了许多应用程序网络指标,例如每秒请求数、故障数、熔断事件等。
服务网格: 负责通过实现重试、超时和熔断器等功能,使服务通信能够灵活应对故障。
Istio 的控制平面 (
istiod) 用于配置 Istio 代理,用于处理路由、安全性、遥测收集和弹性。请求指标会定期发送回各种收集服务。分布式跟踪跨度(如 Jaeger 或 Zipkin)被发送回跟踪存储,稍后可用于跟踪请求通过系统的路径和延迟。
Istio 可以管理密钥和证书的颁发、安装和轮换,以便服务开箱即用地获得双向 TLS。
Istio 为两大类可观察性创建了遥测。第一类是顶线指标,如每秒请求数、故障数和尾部延迟百分位数。
其次,Istio 可以为 OpenTracing.io 这样的分布式跟踪提供便利。Istio 可以将跨度发送到分布式跟踪后端,而无需应用程序操心。
服务网格的缺点是什么?#
- 使用服务网格将另一个中间件(特别是代理)放入请求路径中。这个代理可以提供很多价值;但对于那些不熟悉代理的人来说,它最终可能成为一个黑匣子,使调试应用程序的行为变得更加困难。
- 使用服务网格的另一个缺点是租赁。网格与网格中运行的服务一样有价值。也就是说,网格中的服务越多,网格对于操作这些服务就越有价值。但是,如果没有适当的策略、自动化和深思熟虑进入物理网格部署的租户和隔离模型,您最终可能会遇到错误配置网格会影响许多服务的情况。
- 最后,服务网格成为服务和应用程序体系结构中至关重要的部分,因为它位于请求路径上。服务网格可以公开许多机会来提高安全性、可观测性和路由控制状态。
Istio会使用Kubernetes的服务注册中心来发现服务。
Istio 定义了以下默认提供程序:
prometheus、stackdriver和envoy。您可以使用网格配置中的ExtensionProviderAPI 定义自定义提供程序 (http://mng.bz/REKP)。性能优化
PILOT_FILTER_GATEWAY_CLUSTER_CONFIG
安装使用#
使用 istioctl 部署#
curl -L https://istio.io/downloadIstio | ISTIO_VERSION=1.17.6 sh -

# 检查当前集群安装是否存在问题
istioctl x precheck

# 安装 DEMO 版本
istioctl install --set profile=demo -y

# 查看 POD 是否就绪
kubectl get pod -n istio-system

# 验证安装
istioctl verify-install
安装控制平面支持组件。
这些组件不是严格必需的,但应该为任何实际部署 Istio 安装。
kubectl apply -f ./samples/addons- 可视化由代理生成并由 Prometheus 收集的指标
- 分布式跟踪系统,可视化通过网格的请求流
- 网格的 Web 控制台
- 收集生成的指标并将其存储为时间序列数据
Istio 控制平面#
- 控制平面为服务网格的用户提供了一种控制、观察、管理和配置网格的方法。对于 Istio,控制平面提供了以下功能:
- 供操作员指定所需路由/弹性行为的 API
- 数据平面使用其配置的 API
- 数据平面的服务发现抽象
- 用于指定使用策略的 API
- 证书颁发和轮换
- 工作负载标识分配
- 统一遥测收集
- 服务代理挎斗注入
- 网络边界的规范以及如何访问它们
这些职责中的大部分是在称为 的单个控制平面组件中实现的 istiod 。
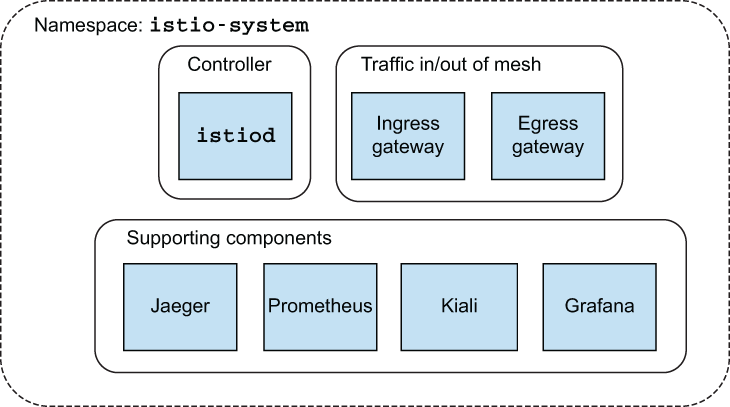
istiod#
Istio 的控制平面职责在
istiod组件中实现。istiod有时也称为 Istio Pilot,负责接收用户/操作员指定的更高级别的 Istio 配置,并将其转化为每个数据平面服务代理的特定代理配置
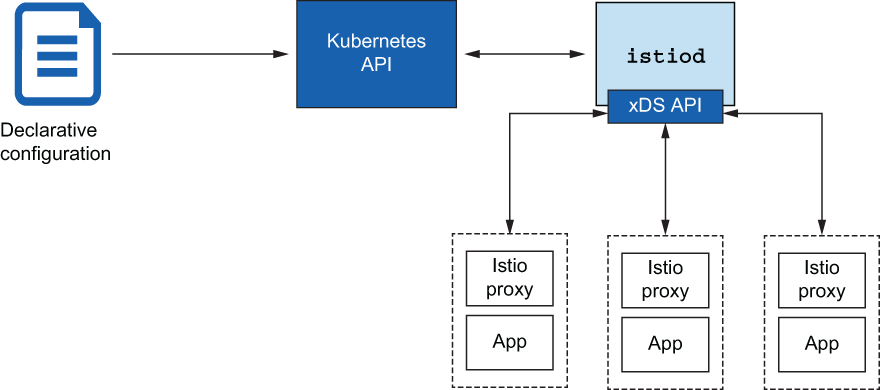
istiod获取这些配置并对其进行解释,然后将其作为特定于服务的配置公开。Istio 将 Envoy 用作其服务代理,因此这些配置会被转换为 Envoy 配置istiod公开的数据平面 API 实现了 Envoy 的发现 API- 这些发现 API(如用于服务发现(监听器发现服务 [LDS])、端点(端点发现服务 [EDS])和路由规则(路由发现服务 [RDS])的 API)被称为 xDS API。
- 这些 API 允许数据平面分离其配置方式,并动态调整其行为,而无需停止和重新加载。
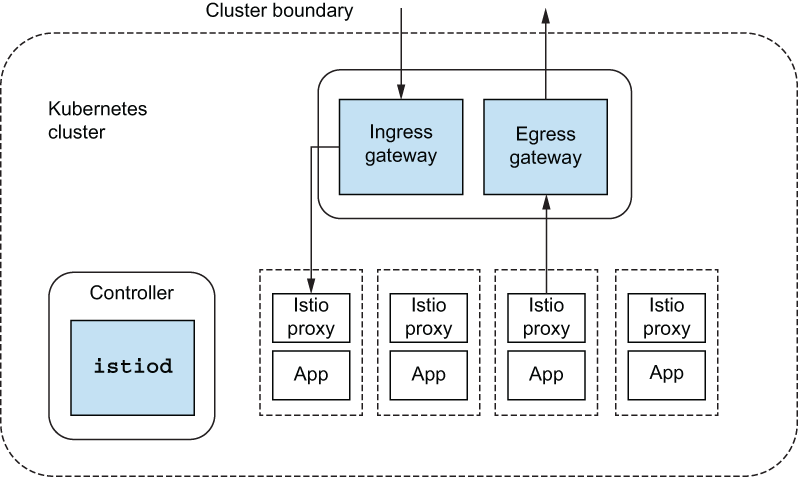
- 服务代理与每个应用程序实例并行运行,
所有应用程序流量都通过这些代理传输 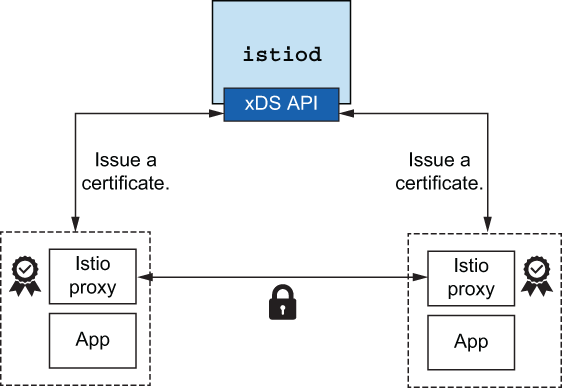
-
istio-ingressgateway和istio-egressgateway。以允许流量进入集群,并明确允许哪些流量离开集群。
部署应用#
YAML
$ kubectl create namespace istioinaction $ kubectl config set-context $(kubectl config current-context) \ --namespace=istioinactionapiVersion: v1 kind: Service metadata: labels: app: catalog name: catalog spec: ports: - name: http port: 80 protocol: TCP targetPort: 3000 selector: app: catalog --- apiVersion: apps/v1 kind: Deployment metadata: labels: app: catalog version: v1 name: catalog spec: replicas: 1 selector: matchLabels: app: catalog version: v1 template: metadata: labels: app: catalog version: v1 spec: containers: - env: - name: KUBERNETES_NAMESPACE valueFrom: fieldRef: fieldPath: metadata.namespace image: istioinaction/catalog:latest imagePullPolicy: IfNotPresent name: catalog ports: - containerPort: 3000 name: http protocol: TCP securityContext: privileged: false对该 APP 进行 Istio 注入
istioctl kube-inject -f catalog.yaml|kubectl apply -f -命名空间的自动注入,添加如下 Lable 即可
kubectl label namespace istioinaction istio-injection=enabled验证是否就绪
 kubectl run -i -n default --rm --restart=Never dummy \
--image=curlimages/curl --command -- \
sh -c 'curl -s http://catalog.istioinaction/items/1'
istioctl 使用记录#
参考文档: https://istio.io/latest/docs/reference/commands/istioctl/
查看当前配置
istioctl profile dump命令补全
istioctl completion zsh > $(brew --prefix)/share/zsh/site-functions/_istioctl检查路由
istioctl proxy-config routes \
deploy/istio-ingressgateway.istio-system
查看 Gateway 路由配置
istioctl proxy-config route deploy/istio-ingressgateway \
-o json --name http.8080  -n istio-system
查看 Gateway 所监听的地址
istioctl -n istio-system proxy-config \
listener deploy/istio-ingressgateway
检查通过 SDS 交付的证书的状态
istioctl pc secret -n istio-system deploy/istio-ingressgateway如果您没有看到新的证书配置生效,可以重建
istio-ingressgateway解决kubectl delete po -n istio-system -l app=istio-ingressgateway
更新配置
istioctl profile dump > config.yaml

istioctl upgrade -f ./config.yaml
更新#
# 更新 istioctl

curl -L https://istio.io/downloadIstio | ISTIO_VERSION=1.19.0 sh -

istioctl version

istioctl x precheck

istioctl upgrade
Envoy proxy#
笔记#
Envoy 由 Lyft 开发,旨在解决构建分布式系统时出现的一些应用网络难题。Envoy 采用
C++编写,旨在提高性能,更重要的是,使其在更高负载梯队中更加稳定和确定。开箱即用的Envoy能理解HTTP 1.1、HTTP 2、gRPC和其他协议,并能添加请求级超时、重试、每次重试超时、熔断和其他弹性功能等行为。
而只能理解连接的基本连接级(L3/L4)代理无法实现这样的功能。Envoy 的设计目的是通过在应用程序进程外运行,
使开发人员免受网络问题的困扰。Istio 的控制平面开箱即实现了 Envoy 服务发现 API。
Envoy 为以下策略提供了开箱即用的
负载均衡算法- Random: 随机
- Round robin: 轮训
- Weighted, least request: 加权,最少请求
- Consistent hashing (sticky): hash 粘性
Envoy 支持基于百分比(即加权)的流量分割/转移。Envoy 还能复制流量,并以 “触发即遗忘 “的模式将该流量阴影化到 Envoy 集群中。
Envoy 可以向 OpenTracing ( http://opentracing.io) 引擎报告跟踪跨度,以便在调用图中直观显示流量、跳数和延迟。
Envoy 还支持 Lua (www.lua.org) 脚本和 WebAssembly (Wasm),从而以较低的侵入式方法扩展 Envoy 功能。
Envoy 主要特性
- 服务发现
- 负载均衡
- 流量和请求路由
- 流量转移和镜像功能
- 网络复原力,重试
- HTTP/2 和 GRPC 支持
- 可观察性与指标收集
- 分布式跟踪的可观察性
- 自动 TLS 生命周期管理
- 流量费率限制
- 支持自定义扩展
Envoy 优势
- 支持 HTTP/2(上游和下游)
- WebAssembly 的可扩展性
- 为维护和扩展而构建的模块化代码库
- 深度协议指标收集
- C++ / 无垃圾收集
- 动态配置,无需热重启
Envoy 由 JSON 或 YAML 格式的配置文件驱动。最初的版本(v1 和 v2)已被弃用,取而代之的是 v3。
Envoy 使用以下 API 进行动态配置: ( 这些 API 统称为
xDS服务。一个配置可以使用其中的一个或某些组合,不必全部使用。)- 监听器发现服务 (LDS)–一种允许 Envoy 查询应在此代理上公开哪些监听器的 API。
- 群集发现服务 (CDS)–一种 API,可让 Envoy 发现该代理应拥有哪些群集以及每个群集各自的配置。
- 端点发现服务 (EDS)–群集配置的一部分,用于指定特定群集使用哪些端点。这是 CDS 的子集。
- 秘密发现服务 (SDS)–用于分发证书的 API。
- 聚合发现服务 (ADS)–对其他 API 的所有更改进行序列化的数据流。您可以使用此单一 API 按顺序获取所有更改。
Envoy 的核心功能#
Envoy 对 L7 流量的概念性理解。
- Listeners : 向外界开放一个端口,应用程序可以连接到该端口。例如,80 端口上的监听器接受流量,并对流量应用任何配置行为
- Routes: 路由规则,用于处理通过侦听器进入的流量。例如,如果收到的请求与
/catalog匹配,则将该流量导向catalog集群。,则将该流量导向catalog集群。 - Clusters: Envoy 可将流量路由至的特定上游服务。例如,
catalog-v1和catalog-v2可以是独立的群集,路由可以指定有关如何将流量导向catalog服务的 v1 或 v2 的规则。
Envoy 功能体验#
拉取镜像
docker pull envoyproxy/envoy:v1.19.0
docker pull curlimages/curl
docker pull citizenstig/httpbin
启动第一个容器
$docker run -d --name httpbin citizenstig/httpbin

$docker run -it --rm --link httpbin curlimages/curl \
curl -X GET http://httpbin:8000/headers

{
  "headers": {
    "Accept": "*/*",
    "Host": "httpbin:8000",
    "User-Agent": "curl/8.3.0"
  }
}
创建 Envoy 配置文件
在 15001 端口暴露了一个监听器,并将所有流量路由到我们的
httpbin集群。admin: address: socket_address: { address: 0.0.0.0, port_value: 15000 } static_resources: listeners: - name: httpbin-demo address: socket_address: { address: 0.0.0.0, port_value: 15001 } filter_chains: - filters: - name: envoy.filters.network.http_connection_manager typed_config: "@type": type.googleapis.com/envoy.extensions.filters.network.http_connection_manager.v3.HttpConnectionManager stat_prefix: ingress_http http_filters: - name: envoy.filters.http.router route_config: name: httpbin_local_route virtual_hosts: - name: httpbin_local_service domains: ["*"] routes: - match: { prefix: "/" } route: auto_host_rewrite: true cluster: httpbin_service clusters: - name: httpbin_service connect_timeout: 5s type: LOGICAL_DNS dns_lookup_family: V4_ONLY lb_policy: ROUND_ROBIN load_assignment: cluster_name: httpbin endpoints: - lb_endpoints: - endpoint: address: socket_address: address: httpbin port_value: 8000启动容器
docker run --name proxy --link httpbin envoyproxy/envoy:v1.19.0 \
  --config-yaml "$(cat ch3/simple.yaml)"
测试一下代理服务器
> docker run -it --rm --link proxy curlimages/curl \
   curl  -X GET http://proxy:15001/headers
{
  "headers": {
    "Accept": "*/*",
    "Host": "httpbin",
    "User-Agent": "curl/8.3.0",
    "X-Envoy-Expected-Rq-Timeout-Ms": "15000",
    "X-Request-Id": "a6f3efa5-1f10-4a1f-a18d-fed6006d70ce"
  }
}
# 流量被正确发送到了 httpbin 服务。还新增了一些标头
Envoy 的管理 API#
docker run -it --rm --link proxy curlimages/curl \
curl -X GET http://proxy:15000/stats

docker run -it --rm --link proxy curlimages/curl \
curl -X GET http://proxy:15000/stats | grep retry # 只显示包含 retry 的统计数据
Envoy Ingress#
例如,如果您有 Kafka 或 NATS.io 工作负载,您可能希望公开与这些消息系统的直接 TCP 连接。 Kubernetes Ingress 不允许这样做。
Kubernetes Ingress v1 资源的指定严重不足。没有通用的方法来指定复杂的流量路由规则、流量分割或流量阴影等内容
Istio 决定从头开始构建入口模式,并专门将第 4 层(传输)和第 5 层(会话)属性与第 7 层(应用程序)
路由问题分开。- Istio
Gateway处理 L4 和 L5 问题,而VirtualService处理 L7 问题。
- Istio
Istio 的实现和资源出现在 Gateway API 之前,
并在很多方面启发了 Gateway API。API 网关: Istio 的入口网关并没有
开箱即用地执行这些操作。https://docs.solo.io/gloo-edge/latestIstio 的网关实现允许我们
终止传入的 TLS/SSL 流量,将其传递到后端服务,将任何非 TLS 流量重定向到正确的 TLS 端口,并实现相互 TLS。TLS 握手包括一个更复杂的协议,
该协议结合了用于初始通信的公钥/私钥(非对称),然后创建一个会话密钥(对称),用于 TLS 会话进行加密和加密。解密流量。
VirtualService#
具有虚拟服务的网关路由
apiVersion: networking.istio.io/v1alpha3
kind: VirtualService
metadata:
  name: catalog-vs-from-gw
spec:
  hosts:
  - "catalog.istioinaction.io"
  gateways:
  - coolstore-gateway
  http:
  - route:
    - destination:
        host: catalog
        port:
          number: 80
网关 TLS#
集成cert-manager 之类的工具可以管理密钥 。
- 创建 webapp-credential 配置密钥
kubectl create -n istio-system secret tls webapp-credential \
--key ch4/certs/3_application/private/webapp.istioinaction.io.key.pem \
--cert ch4/certs/3_application/certs/webapp.istioinaction.io.cert.pem
配置 Gateway 使用密钥
apiVersion: networking.istio.io/v1alpha3
kind: Gateway
metadata:
  name: coolstore-gateway
spec:
  selector:
    istio: ingressgateway
  servers:
  - port:
      number: 80
      name: http
      protocol: HTTP
    hosts:
    - "webapp.istioinaction.io"
  - port:
      number: 443
      name: https
      protocol: HTTPS
    tls:
      mode: SIMPLE
      credentialName: webapp-credential
    hosts:
    - "webapp.istioinaction.io"
验证
# 访问 网关的 443 NodePort 端口
curl -v -H "Host: webapp.istioinaction.io" https://192.168.8.170:32316/api/catalog

curl -H "Host: webapp.istioinaction.io" \
https://webapp.istioinaction.io:32316/api/catalog \
--cacert ch4/certs/2_intermediate/certs/ca-chain.cert.pem \
--resolve webapp.istioinaction.io:32316:192.168.8.170

[{"id":1,"color":"amber","department":"Eyewear","name":"Elinor Glasses","price":"282.00"},{"id":2,"color":"cyan","department":"Clothing","name":"Atlas Shirt","price":"127.00"},{"id":3,"color":"teal","department":"Clothing","name":"Small Metal Shoes","price":"232.00"},{"id":4,"color":"red","department":"Watches","name":"Red Dragon Watch","price":"232.00"}]
HTTP 重定向到 HTTPS#
apiVersion: networking.istio.io/v1alpha3
kind: Gateway
metadata:
  name: coolstore-gateway
spec:
  selector:
    istio: ingressgateway
  servers:
  - port:
      number: 80
      name: http
      protocol: HTTP
    hosts:
    - "webapp.istioinaction.io"
    tls:
      httpsRedirect: true
  - port:
      number: 443
      name: https
      protocol: HTTPS
    tls:
      mode: SIMPLE
      credentialName: webapp-credential
    hosts:
    - "webapp.istioinaction.io"

curl -L -v http://192.168.8.170:31193/api/catalog \
  -H "Host: webapp.istioinaction.io"
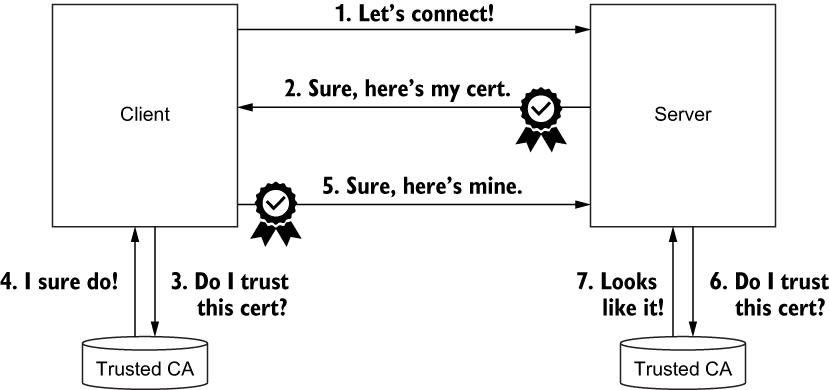
具有双向 TLS 的 HTTP 流量#
直观地展示了客户端和服务器如何通过双向 TLS (mTLS) 协议验证彼此的证书,即相互验证。证书用于加密流量。
配置
istio-ingressgateway-ca-certs密钥kubectl create -n istio-system secret \ generic webapp-credential-mtls --from-file=tls.key=\ ch4/certs/3_application/private/webapp.istioinaction.io.key.pem \ --from-file=tls.crt=\ ch4/certs/3_application/certs/webapp.istioinaction.io.cert.pem \ --from-file=ca.crt=ch4/certs/2_intermediate/certs/ca-chain.cert.pem更新 Istio
Gateway资源以指向 CA 证书链的位置,并将预期协议配置为双向 TLS- port: number: 443 name: https protocol: HTTPS tls: mode: MUTUAL ❶ credentialName: webapp-credential-mtls ❷测试
curl -H "Host: webapp.istioinaction.io" \
https://webapp.istioinaction.io:32316/api/catalog \
--cacert ch4/certs/2_intermediate/certs/ca-chain.cert.pem \
--resolve webapp.istioinaction.io:32316:192.168.8.170

curl: (56) LibreSSL SSL_read: LibreSSL/3.3.6: error:1404C45C:SSL routines:ST_OK:reason(1116), errno 0

# 此调用被拒绝,因为 SSL 握手未成功。我们仅将 CA 证书链传递给 curl 命令;我们还需要传递客户端的证书和私钥。
➜  book-source-code git:(master) ✗ curl -H "Host: webapp.istioinaction.io" \
https://webapp.istioinaction.io:32316/api/catalog \
--cacert ch4/certs/2_intermediate/certs/ca-chain.cert.pem \
--resolve webapp.istioinaction.io:32316:192.168.8.170 \
--cert ch4/certs/4_client/certs/webapp.istioinaction.io.cert.pem \
--key ch4/certs/4_client/private/webapp.istioinaction.io.key.pem
[{"id":1,"color":"amber","department":"Eyewear","name":"Elinor Glasses","price":"282.00"},{"id":2,"color":"cyan","department":"Clothing","name":"Atlas Shirt","price":"127.00"},{"id":3,"color":"teal","department":"Clothing","name":"Small Metal Shoes","price":"232.00"},{"id":4,"color":"red","department":"Watches","name":"Red Dragon Watch","price":"232.00"}]
Istio 网关 SDS
Istio 网关从内置于用于启动
istio-proxy的istio-agent进程中的秘密发现服务 (SDS) 获取证书。 SDS 是一个动态 API,应该自动传播更新。
TLS 为多个虚拟主机提供服务#
  servers:
  - port:
      number: 443             ❶
      name: https-webapp
      protocol: HTTPS
    tls:
      mode: SIMPLE
      credentialName: webapp-credential
    hosts:
    - "webapp.istioinaction.io"
  - port:
      number: 443             ❷
      name: https-catalog
      protocol: HTTPS
TCP 流量#
当 Istio 将流量视为普通 TCP 时,我们无法获得许多有用的功能,例如重试、请求级熔断、复杂路由等。这只是因为 Istio 无法判断正在使用什么协议(除非使用 Istio 理解的特定协议,例如 MongoDB)。
apiVersion: networking.istio.io/v1alpha3
kind: Gateway
metadata:
  name: echo-tcp-gateway
spec:
  selector:
    istio: ingressgateway
  servers:
  - port:
      number: 31400
      name: tcp-echo
      protocol: TCP
    hosts:
    - "*"
---
apiVersion: networking.istio.io/v1alpha3
kind: VirtualService
metadata:
  name: tcp-echo-vs-from-gw
spec:
  hosts:
  - "*"
  gateways:
  - echo-tcp-gateway             ❶
  tcp:
  - match:
    - port: 31400                ❷
    route:
    - destination:
        host: tcp-echo-service   ❸
        port:
          number: 2701
SNI 直通的流量路由#
配置为使用
PASSTHROUGH作为其路由机制的Gateway定义
apiVersion: networking.istio.io/v1alpha3
kind: Gateway
metadata:
  name: sni-passthrough-gateway
spec:
  selector:
    istio: ingressgateway
  servers:
  - port:
      number: 31400                       ❶
      name: tcp-sni
      protocol: TLS
    hosts:
    - "simple-sni-1.istioinaction.io"     ❷
    tls:
      mode: PASSTHROUGH                   ❸

---
kubectl get svc -n istio-system istio-ingressgateway \
  -o jsonpath='{.spec.ports[?(@.name == "tcp")]}'

curl -H "Host: simple-sni-1.istioinaction.io" \
https://simple-sni-1.istioinaction.io:31332/api/catalog \
--cacert ch4/sni/simple-sni-1/2_intermediate/certs/ca-chain.cert.pem  \
--resolve simple-sni-1.istioinaction.io:31332:192.168.8.170
{
  "name": "simple-tls-service-1",
  "uri": "/api/catalog",
  "type": "HTTP",
  "ip_addresses": [
    "10.42.4.12"
  ],
  "start_time": "2023-09-28T11:13:03.866815",
  "end_time": "2023-09-28T11:13:03.866956",
  "duration": "141.018µs",
  "body": "Hello from simple-tls-service-1!!!",
  "code": 200
}
---
# 测试请求使用相同证书的第二个服务
curl -H "Host: simple-sni-2.istioinaction.io" \
https://simple-sni-2.istioinaction.io:31332/api/catalog \
--cacert ch4/sni/simple-sni-2/2_intermediate/certs/ca-chain.cert.pem   \
--resolve simple-sni-2.istioinaction.io:31332:192.168.8.170
{
  "name": "simple-tls-service-2",
  "uri": "/api/catalog",
  "type": "HTTP",
  "ip_addresses": [
    "10.42.8.19"
  ],
  "start_time": "2023-09-28T11:15:05.359662",
  "end_time": "2023-09-28T11:15:05.359796",
  "duration": "134.13µs",
  "body": "Hello from simple-tls-service-2!!!",
  "code": 200
}
自定义网关#
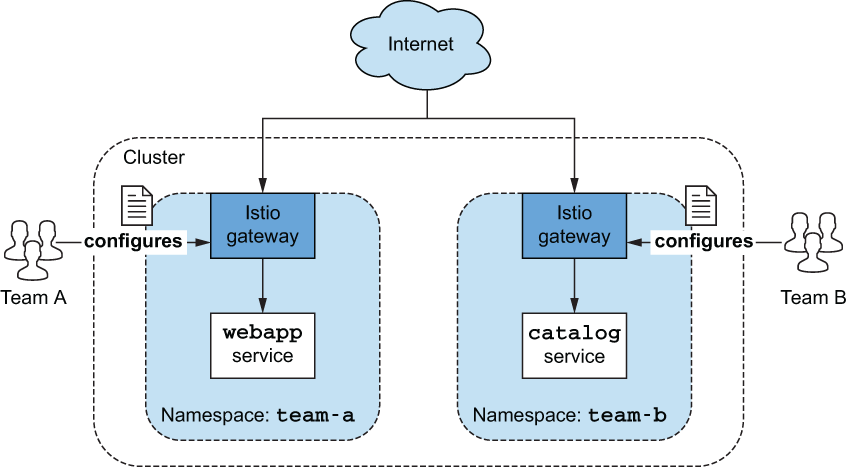
某些服务可能对性能更敏感,或者出于合规性原因需要更高的可用性或隔离性。有时您希望让各个团队拥有自己的网关和配置,而不影响其他团队。
https://istio.io/latest/docs/setup/install/istioctl/#configure-gateways
安装自定义网关
apiVersion: install.istio.io/v1alpha1
kind: IstioOperator
metadata:
  name: my-user-gateway-install
  namespace: istioinaction
spec:
  profile: empty
  values:
    gateways:
      istio-ingressgateway:
        autoscaleEnabled: false
  components:
    ingressGateways:
    - name: istio-ingressgateway
      enabled: false
    - name: my-user-gateway
      namespace: istioinaction
      enabled: true
      label:
        istio: my-user-gateway
---
istioctl install -y -n istioinaction -f ch4/my-user-gateway.yaml
另一种允许用户创建自己的网关而无需授予他们对 IstioOperator 资源(可以修改现有 Istio 安装)的完全访问权限的方法是通过网关注入。
此方法验证未通过
kubectl apply -f << EOF -
apiVersion: apps/v1
kind: Deployment
metadata:
  name: my-user-gateway-injected
  namespace: istioinaction
spec:
  selector:
    matchLabels:
      ingress: my-user-gateway-injected
  template:
    metadata:
      annotations:
        sidecar.istio.io/inject: "true"
        inject.istio.io/templates: gateway
      labels:
        ingress: my-user-gateway-injected
    spec:
      containers:
      - name: istio-proxy
        image: auto
---
apiVersion: v1
kind: Service
metadata:
  name: my-user-gateway-injected
  namespace: istioinaction
spec:
  type: LoadBalancer
  selector:
    ingress: my-user-gateway-injected
  ports:
  - port: 80
    name: http
  - port: 443
    name: https
---
apiVersion: rbac.authorization.k8s.io/v1
kind: Role
metadata:
  name: my-user-gateway-injected-sds
  namespace: istioinaction
rules:
- apiGroups: [""]
  resources: ["secrets"]
  verbs: ["get", "watch", "list"]
---
apiVersion: rbac.authorization.k8s.io/v1
kind: RoleBinding
metadata:
  name: my-user-gateway-injected-sds
  namespace: istioinaction
roleRef:
  apiGroup: rbac.authorization.k8s.io
  kind: Role
  name: my-user-gateway-injected-sds
subjects:
- kind: ServiceAccount
  name: default
EOF
Ingress网关访问日志#
kubectl -n istio-system logs deploy/istio-ingressgateway

# 生产 Istio 安装禁用了 Access 日志记录。但是,您可以通过将 accessLogFile 属性设置为打印到标准输出流来更改此设置
istioctl install --set meshConfig.accessLogFile=/dev/stdout

# 默认情况下,Access 日志是关闭的,考虑到生产集群有数百或数千个工作负载,每个工作负载都处理大量流量,这是有道理的。

# 要仅显示入口网关工作负载的访问日志,您可以使用以下 Telemetry 配置:
apiVersion: telemetry.istio.io/v1alpha1
kind: Telemetry
metadata:
  name: ingress-gateway
  namespace: istio-system
spec:
  selector:
    matchLabels:
      app: istio-ingressgateway    ❶ 与标签匹配的 Pod 获得遥测配置。
  accessLogging:
  - providers:
    - name: envoy                  ❷ 访问日志记录的提供者配置
    disabled: false                ❸ 通过设置disabled为false来启用
telemetry 存在优先级
- Mesh-wide: 配置应用于整个网格中的工作负载。网格范围的配置必须应用在 Istio 安装命名空间中,并且缺少工作负载选择器。
- Namespace-wide: 配置应用于命名空间中的所有工作负载。命名空间范围的配置应用于我们想要配置的工作负载的命名空间,并且还缺少工作负载选择器。这会覆盖应用于工作负载的任何网格范围配置。
- Workload-specific: 配置仅适用于与应用配置的命名空间中的工作负载选择器匹配的工作负载(如前面的代码所示)。特定于工作负载的配置会覆盖网格范围和命名空间范围的配置。
当您部署新网关(例如入口网关)时,代理将配置有可用于网格中路由的所有服务。如前所述,这可能会导致非常大的配置并对网关造成压力。
诀窍是通过仅包含与网关相关的配置来删除代理的任何其他配置。直到最近,此功能还是默认关闭的。在较新的版本中,您可以仔细检查它是否已启用。
PILOT_FILTER_GATEWAY_CLUSTER_CONFIG参考文档:
- https://istio.io/latest/docs/setup/additional-setup/customize-installation/
- https://istio.io/latest/docs/reference/commands/pilot-agent/
- https://zhuanlan.zhihu.com/p/436796453
kubectl get IstioOperator installed-state -o yaml -n istio-system|grep 'PILOT_FILTER_GATEWAY_CLUSTER_CONFIG'

kubectl get IstioOperator installed-state -o yaml -n istio-system|grep 'ISTIO_META_DNS_CAPTURE'

# 1.17.6 中默认关闭
apiVersion: install.istio.io/v1alpha1
kind: IstioOperator
metadata:
  name: control-plane
spec:
  profile: minimal
  components:
    pilot:
      k8s:
        env:
        - name: PILOT_FILTER_GATEWAY_CLUSTER_CONFIG
          value: "true"
  meshConfig:
    defaultConfig:
      proxyMetadata:
        ISTIO_META_DNS_CAPTURE: "true"
    enablePrometheusMerge: true
流量控制#
始之前,让我们先清理一下我们的环境,这样我们就可以从头开始。
kubectl config set-context $(kubectl config current-context) \
 --namespace=istioinaction

kubectl delete deployment,svc,gateway,\
virtualservice,destinationrule --all -n istioinaction
蓝绿发布#
#  catalog 服务的 v1
kubectl apply -f services/catalog/kubernetes/catalog.yaml

# 创建 暴露网关
kubectl apply -f ch5/catalog-gateway.yaml

# 创建 VirtualService
kubectl apply -f ch5/catalog-vs.yaml

# 测试
curl -I http://192.168.8.212/items -H "Host: catalog.istioinaction.io"
HTTP/1.1 200 OK
x-powered-by: Express
vary: Origin, Accept-Encoding
access-control-allow-credentials: true
cache-control: no-cache
pragma: no-cache
expires: -1
content-type: application/json; charset=utf-8
content-length: 502
etag: W/"1f6-ih2h+hDQ0yLLcKIlBvwkWbyQGK4"
date: Thu, 28 Sep 2023 12:37:28 GMT
x-envoy-upstream-service-time: 2
server: istio-envoy

# 部署 V2
kubectl apply -f services/catalog/kubernetes/catalog-deployment-v2.yaml

# 请求 10 次
for in in {1..10}; do curl http://192.168.8.212/items \
-H "Host: catalog.istioinaction.io"; printf "\n\n"; done


# 将所有流量路由到目录服务的 v1

# 1. 创建 DestinationRule,Deplyment 分别配置 app & version 标签
apiVersion: networking.istio.io/v1alpha3
kind: DestinationRule
metadata:
  name: catalog
spec:
  host: catalog
  subsets:
  - name: version-v1
    labels:
      version: v1
  - name: version-v2
    labels:
      version: v2
# 2 流量全部指向 v1 ,配置 v2 则流量全部前往 v2
  - route:
    - destination:
        host: catalog
        subset: version-v1     ❶

kubectl apply -f ch5/catalog-vs-v1.yaml
kubectl apply -f ch5/catalog-vs-v2.yaml
金丝雀发布#
使用请求头实现,
包含 HTTP 标头
x-istio-cohort: internal的任何流量路由到catalog的 v2apiVersion: networking.istio.io/v1alpha3 kind: VirtualService metadata: name: catalog-vs-from-gw spec: hosts: - "catalog.istioinaction.io" gateways: - catalog-gateway http: - match: - headers: x-istio-cohort: exact: "internal" route: - destination: host: catalog subset: version-v2 - route: - destination: host: catalog subset: version-v1 --- curl http://192.168.8.212/items \ -H "Host: catalog.istioinaction.io" -H "x-istio-cohort: internal"按流量比例实现
- 您可以为每个服务版本在 1 到 100 之间调整流量,
但所有权重的总和必须等于 100。如果不等于 100,可能会发生不可预测的流量路由。 - 如果您有 v1 和 v2 以外的版本,则必须在
DestinationRule中将它们声明为subsets。
kubectl delete gateway,virtualservice,destinationrule --all kubectl apply -f services/webapp/kubernetes/webapp.yaml kubectl apply -f services/webapp/istio/webapp-catalog-gw-vs.yaml kubectl get pod -w kubectl apply -f ch5/catalog-dest-rule.yaml kubectl apply -f ch5/catalog-vs-v1-mesh.yaml kubectl apply -f ch5/catalog-vs-v2-request-mesh.yaml # 让我们将 10% 的流量路由到 catalog 的 v2 : apiVersion: networking.istio.io/v1alpha3 kind: VirtualService metadata: name: catalog spec: hosts: - catalog gateways: - mesh http: - route: - destination: host: catalog subset: version-v1 weight: 90 ❶ - destination: host: catalog subset: version-v2 weight: 10 ❷ --- for for in in {1..100}; do curl -s http://192.168.8.212/api/catalog \ -H "Host: webapp.istioinaction.io"|grep -i imageUrl; done|wc -l 12- 您可以为每个服务版本在 1 到 100 之间调整流量,
金丝雀 配合 Flagger 一起发布#
- https://flagger.app/
- 为了让 Flagger 使用任何成功指标,我们需要安装
Prometheus并抓取 Istio 数据平面。已安装跳过
文档: https://docs.flagger.app/tutorials/istio-progressive-delivery
在此 Canary 资源中,我们指定哪个 Kubernetes Deployment 应作为金丝雀的目标、应自动创建哪些 Kubernetes Service 和 Istio VirtualService 以及如何继续金丝雀。 Canary 资源的最后一部分描述了推广金丝雀的速度、需要关注哪些指标来确定可行性以及确定成功的阈值。我们每 45 秒评估一次金丝雀步骤,每一步增加 10% 的流量;当流量达到 50% 时,我们将流量削减至 100%。
- 对于成功率指标,我们只能容忍 1 分钟内 99% 的成功检查。我们还只允许 P99(第 99 个百分位)的请求持续时间为 500 毫秒。如果这些指标偏离我们指定的值超过五个时间间隔,金丝雀将被停止并回滚。
- 在此期间您可以检查金丝雀的状态,如存在问题时,可检查 flagger 中日志, 或执行
kubectl describe canary catalog-release
- 此时,Flagger 已自动创建驱动金丝雀版本所需的一些 Kubernetes 资源,例如 Deployment 、 Service 和 VirtualService 对象。
kubectl get virtualservice catalog -o yaml
# 清理环境
kubectl delete vs,svc,deploy,destinationrule \
--all -n istioinaction
kubectl delete -f ch5/flagger

# 部署应用
kubectl config set-context $(kubectl config current-context) \
 --namespace=istioinaction
kubectl apply -f ./ch5/flagger/catalog-deployment-v1.yaml

#  创建 mesh 网关
kubectl apply -f << EOF -
apiVersion: networking.istio.io/v1alpha3
kind: Gateway
metadata:
  name: mesh
  namespace: istioinaction
spec:
  selector:
    istio: ingressgateway
  servers:
    - port:
        number: 80
        name: http
        protocol: HTTP
      hosts:
        - "*"
EOF

# 部署 prometheus
kubectl apply -f https://raw.githubusercontent.com/istio/istio/release-1.19/samples/addons/prometheus.yaml

# 使用 helm 安装 Flagger
helm repo add flagger https://flagger.app
kubectl apply -f \
  https://raw.githubusercontent.com/fluxcd/flagger/main/artifacts/flagger/crd.yaml

helm install flagger flagger/flagger \
     --namespace=istio-system \
     --set crd.create=false \
     --set meshProvider=istio \
     --set metricsServer=http://prometheus:9090

# CRD 清单
apiVersion: flagger.app/v1beta1
kind: Canary
metadata:
  name: catalog-release
  namespace: istioinaction
spec:
  targetRef:                  ❶ 部署到金丝雀
    apiVersion: apps/v1
    kind: Deployment
    name: catalog
  progressDeadlineSeconds: 60
  # Service / VirtualService Config
  service:                    ❷ 服务配置
    name: catalog
    port: 80
    targetPort: 3000
    gateways:
    - mesh
    hosts:
    - catalog
  analysis:                   ❸ 金丝雀进展参数
    interval: 45s
    threshold: 5
    maxWeight: 50
    stepWeight: 10
    metrics:
    - name: request-success-rate
      thresholdRange:
        min: 99
      interval: 1m
    - name: request-duration
      thresholdRange:
        max: 500
      interval: 30s

# 在此 Canary 资源中,我们指定哪个 Kubernetes Deployment 应作为金丝雀的目标、应自动创建哪些 Kubernetes Service 和 Istio VirtualService 以及如何继续金丝雀。 Canary 资源的最后一部分描述了推广金丝雀的速度、需要关注哪些指标来确定可行性以及确定成功的阈值。我们每 45 秒评估一次金丝雀步骤,每一步增加 10% 的流量;当流量达到 50% 时,我们将流量削减至 100%。
#   - 对于成功率指标,我们只能容忍 1 分钟内 99% 的成功检查。我们还只允许 P99(第 99 个百分位)的请求持续时间为 500 毫秒。如果这些指标偏离我们指定的值超过五个时间间隔,金丝雀将被停止并回滚。
kubectl apply -f << EOF -
apiVersion: flagger.app/v1beta1
kind: Canary
metadata:
  name: catalog-release
  namespace: istioinaction
spec:
  targetRef:
    apiVersion: apps/v1
    kind: Deployment
    name: catalog
  progressDeadlineSeconds: 60
  # Service / VirtualService Config
  service:
    name: catalog
    port: 80
    targetPort: 3000
    gateways:
    - public-gateway.istio-system.svc.cluster.local
    hosts:
    - test.example.com
  analysis:
    interval: 45s
    threshold: 5
    maxWeight: 50
    stepWeight: 10
    metrics:
    - name: request-success-rate
      thresholdRange:
        min: 99
      interval: 1m
    - name: request-duration
      thresholdRange:
        max: 500
      interval: 30s
EOF

# 更新镜像,触发更新
kubectl -n istioinaction set image deployment/catalog \
catalog=yangzun/istio-catalog:latest

# 在此期间您可以检查金丝雀的状态,如存在问题时,可检查 flagger 中日志, 或执行 kubectl describe canary catalog-release
kubectl get canary catalog-release -w

# 此时,Flagger 已自动创建驱动金丝雀版本所需的一些 Kubernetes 资源,例如 Deployment 、 Service 和 VirtualService 对象。
kubectl get virtualservice catalog -o yaml

kubectl get gw -o yaml

# 滚动更新时,需要有流量请求,来触发 analysis 中的阈值更新。请求网关地址时,需要正确可以路由到后端
while true; do curl "http://192.168.8.212" \
-H "Host: test.example.com" ; sleep 1; done

curl -s http://192.168.8.212 -H "Host: test.example.com"
kubectl apply -f << EOF -
apiVersion: networking.istio.io/v1alpha3
kind: Gateway
metadata:
  name: public-gateway
  namespace: istio-system
spec:
  selector:
    istio: ingressgateway
  servers:
    - port:
        number: 80
        name: http
        protocol: HTTP
      hosts:
        - "*"
EOF

kubectl create ns test
kubectl label namespace test istio-injection=enabled

kubectl apply -k https://github.com/fluxcd/flagger//kustomize/podinfo?ref=main

kubectl apply -k https://github.com/fluxcd/flagger//kustomize/tester?ref=main


kubectl apply -f << EOF -
apiVersion: flagger.app/v1beta1
kind: Canary
metadata:
  name: podinfo
  namespace: test
spec:
  # deployment reference
  targetRef:
    apiVersion: apps/v1
    kind: Deployment
    name: podinfo
  # the maximum time in seconds for the canary deployment
  # to make progress before it is rollback (default 600s)
  progressDeadlineSeconds: 60
  # HPA reference (optional)
  autoscalerRef:
    apiVersion: autoscaling/v2beta2
    kind: HorizontalPodAutoscaler
    name: podinfo
  service:
    # service port number
    port: 9898
    # container port number or name (optional)
    targetPort: 9898
    # Istio gateways (optional)
    gateways:
    - public-gateway.istio-system.svc.cluster.local
    # Istio virtual service host names (optional)
    hosts:
    - app.example.com
    # Istio traffic policy (optional)
    trafficPolicy:
      tls:
        # use ISTIO_MUTUAL when mTLS is enabled
        mode: DISABLE
    # Istio retry policy (optional)
    retries:
      attempts: 3
      perTryTimeout: 1s
      retryOn: "gateway-error,connect-failure,refused-stream"
  analysis:
    # schedule interval (default 60s)
    interval: 1m
    # max number of failed metric checks before rollback
    threshold: 5
    # max traffic percentage routed to canary
    # percentage (0-100)
    maxWeight: 50
    # canary increment step
    # percentage (0-100)
    stepWeight: 10
    metrics:
    - name: request-success-rate
      # minimum req success rate (non 5xx responses)
      # percentage (0-100)
      thresholdRange:
        min: 99
      interval: 1m
    - name: request-duration
      # maximum req duration P99
      # milliseconds
      thresholdRange:
        max: 500
      interval: 30s
    # testing (optional)
    webhooks:
      - name: acceptance-test
        type: pre-rollout
        url: http://flagger-loadtester.test/
        timeout: 30s
        metadata:
          type: bash
          cmd: "curl -sd 'test' http://podinfo-canary:9898/token | grep token"
      - name: load-test
        url: http://flagger-loadtester.test/
        timeout: 5s
        metadata:
          cmd: "hey -z 1m -q 10 -c 2 http://podinfo-canary.test:9898/"
EOF


# 更新镜像触发金丝雀更新

kubectl -n test set image deployment/podinfo \
podinfod=ghcr.io/stefanprodan/podinfo:6.0.1


# 查看正在进行的所有 金丝雀
watch kubectl get canaries --all-namespaces

curl -s http://192.168.8.212 -H "Host: app.example.com"
流量镜像#
https://istio.io/latest/docs/tasks/traffic-management/mirroring/
集群流量安全#
运行以下命令将 Istio 的默认值从
ALLOW_ANY更改为REGISTRY_ONLY。这意味着只有在服务网格注册表中明确将流量列入白名单时,我们才会允许流量离开网格istioctl install --set profile=demo \ --set meshConfig.outboundTrafficPolicy.mode=REGISTRY_ONLYServiceEntry
可以指定 ServiceEntry 资源,用于增强外部服务并将其插入 Istio 白名单注册表,白名单。
# 此 ServiceEntry 资源会在 Istio 的服务注册表中插入一个条目,明确规定允许网格中的客户端使用主机 jsonplaceholder.typicode.com 调用 JSON 占位符。
apiVersion: networking.istio.io/v1alpha3
kind: ServiceEntry
metadata:
  name: jsonplaceholder
spec:
  hosts:
  - jsonplaceholder.typicode.com
  ports:
  - number: 80
    name: http
    protocol: HTTP
  resolution: DNS
  location: MESH_EXTERNAL

kubectl apply -f services/forum/kubernetes/forum-all.yaml
kubectl apply -f ch5/forum-serviceentry.yaml
恢复能力:解决应用网络挑战#
弹性模式#
- Istio 的服务代理实现了这些开箱即用的基本弹性模式:
- 客户端负载平衡 Client-side load balancing
- 本地感知负载平衡 Locality-aware load balancing
- Circuit breaking 熔断
- Timeouts and retries 超时和重试
客户端负载平衡#
ROUND_ROBIN 是默认的负载均衡算法
kubectl config set-context $(kubectl config current-context) \
 --namespace=istioinaction
kubectl delete virtualservice,deployment,service,\
destinationrule,gateway --all


kubectl apply -f ch6/simple-backend.yaml
kubectl apply -f ch6/simple-web.yaml
kubectl apply -f ch6/simple-web-gateway.yaml

# 用 Istio DestinationRule 资源为调用 simple-backend 服务的任何客户端指定 ROUND_ROBIN 负载平衡。
curl -s -H "Host: simple-web.istioinaction.io" http://192.168.8.212


for in in {1..10}; do \
curl -s -H "Host: simple-web.istioinaction.io" 192.168.8.212 \
| jq ".upstream_calls[0].body"; printf "\n"; done
Fortio 负载测试库#
# 安装
brew install fortio

# 运行
kubectl -n default run fortio --image=fortio/fortio:1.60.2 \
--restart='Never' -- load -H "Host: simple-web.istioinaction.io" \
-jitter -t 60s -c 10 -qps 1000 \
http://192.168.8.212
测试结果
最少连接比随机连接和循环连接的性能都要好- 最少连接负载平衡器(在 Envoy 中以最少请求方式实现)会考虑特定端点的延迟。
- 它会监控队列深度,跟踪活动请求,并选择飞行中活动请求最少的端点。利用这种算法,我们可以避免向行为不佳的端点发送请求,而选择响应速度更快的端点。
- 尽管 Istio 配置将最少请求负载平衡称为
LEAST_CONN,但 Envoy 追踪的是端点而非连接的请求深度。
本地感知负载平衡#
Istio 支持一种负载平衡类型,可根据特定工作负载的位置为路由赋予权重并做出路由决策。Istio 可以识别部署特定服务的区域和可用性区域,并优先考虑距离较近的服务。
实践#
节点标注
分别指定地区和区域 - 标签
failure-domain.beta.kubernetes.io/regionfailure-domain.beta.kubernetes.io/zone
在 Kubernetes API 最近的通用版本中,这些标签已被
topology.kubernetes.io/region和topology.kubernetes.io/zone所取代。云供应商仍在使用较旧的failure-domain标签。Istio可同时查找这两种标签。
POD 标注
我们可以用
istio-locality标记我们的 Podspec: replicas: 1 selector: matchLabels: app: simple-web template: metadata: labels: app: simple-web istio-locality: us-west1.us-west1-a ❶
验证
默认情况下,Istio 的服务代理会将所有流量发送到同一本地的服务,只有当出现故障或端点不健康时才会溢出。
# Case-1 当 backend-1 存在故障时,将流量切换至 backend-2
kubectl apply -f ch6/simple-service-locality.yaml

for in in {1..10}; do \
curl -s -H "Host: simple-web.istioinaction.io" 192.168.8.212 \
| jq ".upstream_calls[0].body"; printf "\n"; done


# 在 Istio 中实现本地感知负载均衡,我们还需要配置最后一块拼图:健康检查。
kubectl apply -f ch6/simple-backend-dr-outlier.yaml

for in in {1..10}; do \
curl -s -H "Host: simple-web.istioinaction.io" 192.168.8.212 \
| jq ".upstream_calls[0].body"; printf "\n"; done


# 将 backend-1 设置为故障
for for in in {1..10}; do \
curl -s -H "Host: simple-web.istioinaction.io" 192.168.8.212 \
| jq ".upstream_calls[0].body"; printf "\n"; done
null
"Hello from simple-backend-2"
"Hello from simple-backend-2"
"Hello from simple-backend-2"
"Hello from simple-backend-2"
"Hello from simple-backend-2"
"Hello from simple-backend-2"
"Hello from simple-backend-2"
"Hello from simple-backend-2"
"Hello from simple-backend-2"
利用加权分布对本地负载平衡进行更多控制
# 为了完成这一配置,我们在 DestinationRule 资源中指定了本地化负载均衡首选项:

apiVersion: networking.istio.io/v1beta1
kind: DestinationRule
metadata:
  name: simple-backend-dr
spec:
  host: simple-backend.istioinaction.svc.cluster.local
  trafficPolicy:
    loadBalancer:                        ❶ 添加负载平衡器配置
      localityLbSetting:
        distribute:
        - from: us-west1/us-west1-a/*    ❷ 来自的区域
          to:
            "us-west1/us-west1-a/*": 70  ❸ 目的地区域
            "us-west1/us-west1-b/*": 30  ❹ 目的地区域
    connectionPool:
      http:
        http2MaxRequests: 10
        maxRequestsPerConnection: 10
    outlierDetection:
      consecutive5xxErrors: 1
      interval: 5s
      baseEjectionTime: 30s

# 应用
kubectl apply -f ch6/simple-backend-dr-outlier-locality.yaml

for for in in {1..10}; do \
curl -s -H "Host: simple-web.istioinaction.io" 192.168.8.212 \
| jq ".upstream_calls[0].body"; printf "\n"; done
null
透明超时和重试#
在构建依赖分布在网络上的组件的系统时,最大的问题包括延迟和故障。
分布式环境中最难处理的情况之一就是延迟。当运行速度减慢时,资源可能会被占用更长时间,服务可能会出现倒退,这种情况有可能引发连锁故障。
# 重置集群
kubectl apply -f ch6/simple-web.yaml
kubectl apply -f ch6/simple-backend.yaml
kubectl delete destinationrule simple-backend-dr

for in in {1..10}; do time curl -s \
-H "Host: simple-web.istioinaction.io" 192.168.8.212  \
| jq .code; printf "\n"; done

# 部署一个 simple-backend 服务版本,为该实例的 50% 调用插入一秒钟的处理延迟:
kubectl apply -f ch6/simple-backend-delayed.yaml


# 再次请求,有些请求需要一秒钟或更长的时间:
for in in {1..10}; do time curl -s \
-H "Host: simple-web.istioinaction.io" 192.168.8.212  \
| jq .code; printf "\n"; done
200
curl -s -H "Host: simple-web.istioinaction.io" 192.168.8.212  0.00s user 0.00s system 0% cpu 1.068 total
jq .code  0.01s user 0.00s system 1% cpu 1.068 total

200
curl -s -H "Host: simple-web.istioinaction.io" 192.168.8.212  0.00s user 0.01s system 0% cpu 1.035 total
jq .code  0.02s user 0.00s system 1% cpu 1.034 total

200
curl -s -H "Host: simple-web.istioinaction.io" 192.168.8.212  0.01s user 0.01s system 5% cpu 0.194 total
jq .code  0.03s user 0.00s system 13% cpu 0.194 total


---
#  在 VirtualService 中指定超时时间
  http:
  - route:
    - destination:
        host: simple-backend
    timeout: 0.5s               ❶ 指定超时值

# 应用
kubectl apply -f ch6/simple-backend-vs-timeout.yaml


# 再次请求,此时大于 0.5s 的请求,会被判断为 500错误
for for in in {1..10}; do time curl -s \
-H "Host: simple-web.istioinaction.io" 192.168.8.212  \
| jq .code; printf "\n"; done
200
curl -s -H "Host: simple-web.istioinaction.io" 192.168.8.212  0.00s user 0.00s system 4% cpu 0.176 total
jq .code  0.02s user 0.00s system 10% cpu 0.175 total

500
curl -s -H "Host: simple-web.istioinaction.io" 192.168.8.212  0.01s user 0.01s system 2% cpu 0.550 total
jq .code  0.02s user 0.00s system 4% cpu 0.549 total

200
curl -s -H "Host: simple-web.istioinaction.io" 192.168.8.212  0.01s user 0.01s system 6% cpu 0.188 total
jq .code  0.02s user 0.00s system 14% cpu 0.187 total
重试
# Reset
kubectl apply -f ch6/simple-web.yaml
kubectl apply -f ch6/simple-backend.yaml

# Istio 默认启用了重试功能,最多重试两次。让我们禁用示例应用程序的默认重试, 将最大重试次数设置为 0
istioctl install --set profile=demo \
 --set meshConfig.defaultHttpRetryPolicy.attempts=0

# 部署一个有周期性(75%)故障的 simple-backend 服务版本。
kubectl apply -f ch6/simple-backend-periodic-failure-503.yaml

# 执行 多次调用该服务
for in in {1..10}; do curl -s \
-H "Host: simple-web.istioinaction.io" 192.168.8.212  \
| jq .code; printf "\n"; done
200
curl -s -H "Host: simple-web.istioinaction.io" 192.168.8.212  0.00s user 0.00s system 3% cpu 0.176 total
jq .code  0.01s user 0.00s system 8% cpu 0.175 total

500
curl -s -H "Host: simple-web.istioinaction.io" 192.168.8.212  0.00s user 0.01s system 31% cpu 0.034 total
jq .code  0.02s user 0.00s system 74% cpu 0.033 total

500
curl -s -H "Host: simple-web.istioinaction.io" 192.168.8.212  0.00s user 0.00s system 27% cpu 0.024 total
jq .code  0.02s user 0.00s system 73% cpu 0.023 total


# 调用 simple-backend 时的重试尝试明确配置为 2
  http:
  - route:
    - destination:
        host: simple-backend
    retries:
      attempts: 2

kubectl apply -f ch6/simple-backend-enable-retry.yaml

# 再次查看
for in in {1..10}; do curl -s \
-H "Host: simple-web.istioinaction.io" 192.168.8.212  \
| jq .code; printf "\n"; done
200
200
200

# 启用了 Istio 的重试策略来解决这些错误。默认情况下,HTTP 503 是可重试状态代码之一。
# 下面的 VirtualService 重试策略显示了重试时可配置的参数:
  http:
  - route:
    - destination:
        host: simple-backend
    retries:
      attempts: 2                                             ❶
      retryOn: gateway-error,connect-failure,retriable-4xx    ❷
      perTryTimeout: 300ms                                    ❸
      retryRemoteLocalities: true                             ❹

❶ 最大重试次数
❷ 需要重试的错误
❸ 超时
❹是否重试其他地区的端点

# 部署的 simple-backend 服务返回 HTTP 500 代码,默认重试行为将无法捕获
for in in {1..10}; do curl -s \
-H "Host: simple-web.istioinaction.io" 192.168.8.212  \
| jq .code; printf "\n"; done
200
200
200
200
200
200
200
200
500
200

# 使用 VirtualService 重试策略,重试所有 HTTP 500 代码(包括 connect-failure 和 refused-stream )
  http:
  - route:
    - destination:
        host: simple-backend
    retries:
      attempts: 2
      retryOn: 5xx     ❶

kubectl apply -f ch6/simple-backend-vs-retry-500.yaml

# 此时执行,将不存在 500 异常
for in in {1..10}; do curl -s \
-H "Host: simple-web.istioinaction.io" 192.168.8.212  \
| jq .code; printf "\n"; done
200
200
200
200
200
200
200
200
200
200
超时计算的重试次数 & 原理#
每次重试都有自己的
perTryTimeout,perTryTimeout值乘以总尝试次数必须小于总请求超时- 例如,总超时时间为一秒,重试策略为三次,每次重试超时时间为 500 毫秒,这样的设置是行不通的。
当请求流经 Istio 服务代理时,如果
未能向上游交付,则会被标记为失败并重试,重试次数最多可达VirtualService资源中定义的最大attempts字段。- 意味着当
attempts值为2时的情况下,请求最多会被交付三次:原始请求一次,重试两次。
- 意味着当
Istio 将以 25 毫秒为基数 “后退 “重试。
- 这意味着每次连续重试时,Istio 都会后退(等待)至(25 毫秒 x 尝试次数 #),以错开重试时间。
- 重试基础是固定的
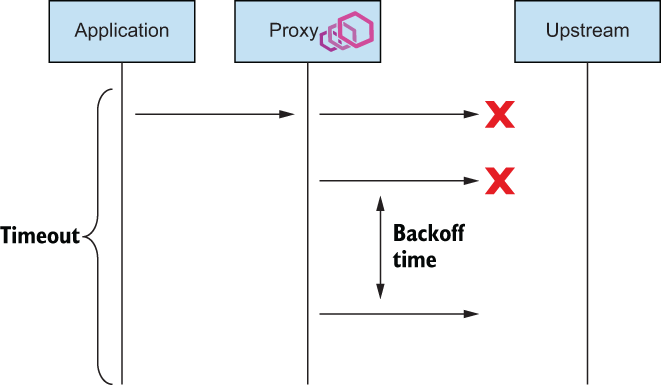
请求失败时重试的请求流程
Istio 默认将重试
attempts设置为2。.您可能希望覆盖此设置,以便系统的不同层重试不同次数。天真的重试设置(如默认设置)会导致严重的重试 “thundering herd “问题例如,如果一个服务链有 5 个深度调用,每个步骤可以重试请求 2 次,那么每个传入请求可能会有
32 个请求。如果服务链末端的资源超载,这些额外的负载可能会使目标资源不堪重负,以至于崩溃。这些额外的负载可能会使目标资源不堪重负,以至于崩溃。处理这种情况的一种方法是,将架构边缘的重试尝试限制为一次或零次,只在调用栈深处重试,中间组件不重试。
这可能也不会有很好的效果。另一种策略是对总重试次数设置上限。我们可以通过重试预算来做到这一点,但 Istio API 还没有公开预算。- Istio 中存在解决这一问题的变通方法,
但不在本书讨论范围之内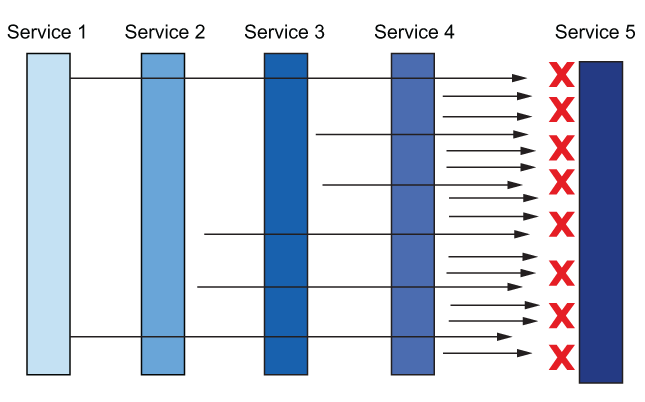
- Istio 中存在解决这一问题的变通方法,
重试相互复合时的 “thundering herd “效应
- 默认情况下,将尝试对本地区的端点进行重试。retryRemoteLocalities设置会影响此行为:如果将其设置为true,则Istio允许重试溢出到其他地区。在异常检测确定本地首选端点表现不佳之前,这可能非常有用。
高级重试#
默认情况下,回退时间为
25 毫秒,可重试代码仅限于HTTP 503尽管在撰写本文时,Istio API 并未公开这些配置,但我们可以使用 Istio 扩展 API 直接在 Envoy 配置中更改这些值。我们使用EnvoyFilterAPI 来实现
apiVersion: networking.istio.io/v1alpha3
kind: EnvoyFilter
metadata:
  name: simple-backend-retry-status-codes
  namespace: istioinaction
spec:
  workloadSelector:
    labels:
      app: simple-web
  configPatches:
  - applyTo: HTTP_ROUTE
    match:
      context: SIDECAR_OUTBOUND
      routeConfiguration:
        vhost:
          name: "simple-backend.istioinaction.svc.cluster.local:80"
    patch:
      operation: MERGE
      value:
        route:
          retry_policy:                ❶ 直接从Envoy配置中获取
            retry_back_off:
              base_interval: 50ms      ❷ 增加基本间隔
            retriable_status_codes:    ❸ 添加可重试代码
            - 408
            - 400

# 应用
kubectl apply -f ch6/simple-backend-ef-retry-status-codes.yaml

# 还希望更新 retryOn 字段,使其包含 retriable-status-codes

apiVersion: networking.istio.io/v1alpha3
kind: VirtualService
metadata:
  name: simple-backend-vs
spec:
  hosts:
  - simple-backend
  http:
  - route:
    - destination:
        host: simple-backend
    retries:
      attempts: 2
      retryOn: 5xx,retriable-status-codes     ❶ 包括可重试的状态码


kubectl apply -f ch6/simple-backend-vs-retry-on.yaml


# 更新 sample-backend 服务,使其返回 HTTP 408(超时),并验证是否能继续获得 HTTP 200
kubectl apply -f ch6/simple-backend-periodic-failure-408.yaml

# 验证
for in in {1..10}; do curl -s \
-H "Host: simple-web.istioinaction.io" 192.168.8.212  \
| jq .code; printf "\n"; done
请求对冲#
当请求达到其阈值并超时时,我们可以选择配置Envoy,在底层执行所谓的请求hedging。通过请求hedging,如果一个请求超时了,Envoy可以发送另一个请求到不同的主机上,“竞赛”原始的、超时的请求。在这种情况下,如果竞赛的请求成功返回,则将其响应发送给原始下游调用者。如果原始请求在竞赛请求返回之前返回,则将原始请求返回给下游调用者。
# 要设置请求对冲,我们可以使用以下 EnvoyFilter 资源:
apiVersion: networking.istio.io/v1alpha3
kind: EnvoyFilter
metadata:
  name: simple-backend-retry-hedge
  namespace: istioinaction
spec:
  workloadSelector:
    labels:
      app: simple-web
  configPatches:
  - applyTo: VIRTUAL_HOST
    match:
      context: SIDECAR_OUTBOUND
      routeConfiguration:
        vhost:
          name: "simple-backend.istioinaction.svc.cluster.local:80"
    patch:
      operation: MERGE
      value:
        hedge_policy:
          hedge_on_per_try_timeout: true
超时和重试的主题并不简单。为服务制定良好的超时和重试策略非常具有挑战性,尤其是考虑到它们是如何串联在一起的。配置错误的超时和重试可能会放大系统架构中的不良行为,以至于使系统超载并引发连锁故障。构建弹性架构的最后一个难题是完全跳过重试:与其重试,不如快速失败。我们可以在一段时间内限制负载,让上游系统恢复,而不是增加负载。为此,我们可以采用熔断技术
使用 Istio 熔断#
使用断路功能来帮助防范部分或级联故障。我们希望
减少进入不健康系统的流量,从而避免这些系统继续超负荷运行,导致无法恢复。这种方法与房屋电气系统中空气开关的工作原理类似。如果系统出现短路或重复故障,空气开关就会保护系统的其他部分。熔断器模式迫使我们的应用程序处理网络调用可能发生故障的事实,并有助于保护整个系统免受连锁故障的影响。
无法正常工作的熔断方法#
如果有十个请求正在向某个服务发送,而且在相同的入站负载量下,请求数量还在不断增加,那么继续发送请求就没有意义了–发送更多请求可能会使上游服务不堪重负。我们使用目标规则中的
connectionPool设置来限制调用服务时可能堆积的连接和请求数量。如果请求堆积过多,我们可以短路(快速失败)并返回客户端。第二种控制方法是观察
负载平衡池中端点的健康状况,并暂时驱逐行为不端的端点。
利用连接池控制防止服务速度过慢
- maxConnections-我们报告连接溢出的阈值。Istio代理(Envoy)使用连接来服务请求,上限由此设置定义。实际上,我们可以预期最大连接数为负载均衡池中每个端点加上此设置的值。每当超过这个值时,Envoy将在其指标中报告。
- http1MaxPendingRequests-允许挂起且没有可用连接的请求数。
- http2MaxRequests-Istio中不幸地命名错误。在底层,它控制着集群中所有端点/主机之间并行请求的最大数量,无论是HTTP2还是HTTP1.1(参见https://github.com/istio/istio/issues/27473)。
# 引入一秒钟的延迟
kubectl apply -f ch6/simple-backend-delayed.yaml


# 删除目的地规则
kubectl delete destinationrule --all

fortio load -H "Host: simple-web.istioinaction.io" \
-quiet -jitter -t 30s -c 1 -qps 1 http://192.168.8.212/
Error cases : count 0 avg 0 +/- 0 min 0 max 0 sum 0
# Socket and IP used for each connection:
[0]   1 socket used, resolved to 192.168.8.212:80, connection timing : count 1 avg 0.000936291 +/- 0 min 0.000936291 max 0.000936291 sum 0.000936291
Sockets used: 1 (for perfect keepalive, would be 1)
Uniform: false, Jitter: true, Catchup allowed: true
IP addresses distribution:
192.168.8.212:80: 1
Code 200 : 30 (100.0 %)
All done 30 calls (plus 1 warmup) 1029.536 ms avg, 1.0 qp

#引入一些连接和请求限制
apiVersion: networking.istio.io/v1beta1
kind: DestinationRule
metadata:
  name: simple-backend-dr
spec:
  host: simple-backend.istioinaction.svc.cluster.local
  trafficPolicy:
    connectionPool:
      tcp:
        maxConnections: 1               ❶ 连接总数
      http:
        http1MaxPendingRequests: 1      ❷ 排队请求
        maxRequestsPerConnection: 1     ❸ 每个连接的请求数量
        maxRetries: 1
        http2MaxRequests: 1             ❹ 所有主机的最大并发请求数量

kubectl apply -f ch6/simple-backend-dr-conn-limit.yaml

fortio load -H "Host: simple-web.istioinaction.io" \
-quiet -jitter -t 30s -c 1 -qps 1 http://192.168.8.212
Code 200 : 30 (100.0 %)

fortio load -H "Host: simple-web.istioinaction.io" \
-quiet -jitter -t 30s -c 2 -qps 2 -allow-initial-errors http://192.168.8.212
Code 200 : 31 (60.8 %)
Code 500 : 20 (39.2 %)
请求返回失败(HTTP 5xx)。我们如何确定这些请求是受断路影响,而不是上游故障?
要确定这些信息,我们需要在 Istio 服务代理中启用更多统计数据收集功能。默认情况下,Istio 的服务代理(Envoy)会为每个群集保存大量统计数据,
但 Istio 会对这些数据进行缩减,以免大量统计数据使收集代理(如Prometheus)不堪重负。为了扩展 Istio 公开的统计数据,尤其是上游断路统计数据,我们在
simple-web中使用了annotationssidecar.istio.io/statsInclusionPrefixes
template:
    metadata:
      annotations:
        sidecar.istio.io/statsInclusionPrefixes:
➥"cluster.outbound|80||simple-backend.istioinaction.svc.cluster.local"
      labels:
        app: simple-web
# 在 simple-web 中  应用注释
kubectl apply -f ch6/simple-web-stats-incl.yaml

# 重置 simple-web 服务中 Istio 代理的所有统计数据
kubectl exec -it deploy/simple-web -c istio-proxy \
-- curl -X POST localhost:15000/reset_counters
OK

# 再次产生负载时
fortio load -H "Host: simple-web.istioinaction.io" \
-quiet -jitter -t 30s -c 2 -qps 2 -allow-initial-errors http://192.168.8.212
Code 200 : 30 (55.6 %)
Code 500 : 24 (44.4 %)

# 运行下面的查询
kubectl exec -it deploy/simple-web -c istio-proxy \
-- curl localhost:15000/stats | grep simple-backend | grep overflow
cluster.outbound|80||simple-backend.istioinaction.svc.cluster.local.upstream_cx_overflow: 53
cluster.outbound|80||simple-backend.istioinaction.svc.cluster.local.upstream_cx_pool_overflow: 0
cluster.outbound|80||simple-backend.istioinaction.svc.cluster.local.upstream_rq_pending_overflow: 25
cluster.outbound|80||simple-backend.istioinaction.svc.cluster.local.upstream_rq_retry_overflow: 0

# upstream_cx_overflow 和 upstream_rq_pending_overflow 。这表明有足够多的连接和请求超过了我们指定的阈值(并行请求过多或排队请求过多),导致空气开关跳闸。

# 增加 http2MaxRequests 字段,以应对并行发生的更多请求呢?让我们将该值提高到 2 重置计数器,然后重新运行负载测试
kubectl patch destinationrule simple-backend-dr --type merge \
--patch \
'{"spec": {"trafficPolicy": {"connectionPool": {
  "http": {"http2MaxRequests": 2}}}}}'

kubectl exec -it deploy/simple-web -c istio-proxy \
-- curl -X POST localhost:15000/reset_counters

fortio load -H "Host: simple-web.istioinaction.io" \
-quiet -jitter -t 30s -c 2 -qps 2 -allow-initial-errors http://192.168.8.212
Code 200 : 31 (100.0 %)

# 熔断而受阻的请求减少:
kubectl exec -it deploy/simple-web -c istio-proxy \
-- curl localhost:15000/stats | grep simple-backend | grep overflow
cluster.outbound|80||simple-backend.istioinaction.svc.cluster.local.upstream_cx_overflow: 35
cluster.outbound|80||simple-backend.istioinaction.svc.cluster.local.upstream_cx_pool_overflow: 0
cluster.outbound|80||simple-backend.istioinaction.svc.cluster.local.upstream_rq_pending_overflow: 1
cluster.outbound|80||simple-backend.istioinaction.svc.cluster.local.upstream_rq_retry_overflow: 0


# 将待处理队列深度增加到 2
kubectl patch destinationrule simple-backend-dr --type merge \
--patch \
'{"spec": {"trafficPolicy": {"connectionPool": {
  "http": {"http1MaxPendingRequests": 2}}}}}'

kubectl exec -it deploy/simple-web -c istio-proxy \
-- curl -X POST localhost:15000/reset_counters

fortio load -H "Host: simple-web.istioinaction.io" \
-quiet -jitter -t 30s -c 2 -qps 2 -allow-initial-errors http://192.168.8.212
Code 200 : 32 (100.0 %)

# 此时发生触发熔断重试为 0
kubectl exec -it deploy/simple-web -c istio-proxy \
-- curl localhost:15000/stats | grep simple-backend | grep overflow
cluster.outbound|80||simple-backend.istioinaction.svc.cluster.local.upstream_cx_overflow: 41
cluster.outbound|80||simple-backend.istioinaction.svc.cluster.local.upstream_cx_pool_overflow: 0
cluster.outbound|80||simple-backend.istioinaction.svc.cluster.local.upstream_rq_pending_overflow: 0
cluster.outbound|80||simple-backend.istioinaction.svc.cluster.local.upstream_rq_retry_overflow: 0
upstream_rq_retry_overflow :由于断路器触发或超出重试预算,未重新尝试的总请求数量。
upstream_cx_overflow :集群连接断路器溢出的总次数
更多参数详情请参考: https://www.envoyproxy.io/docs/envoy/latest/configuration/upstream/cluster_manager/cluster_stats
当请求因触及断路阈值而失败时,Istio 的服务代理会添加一个 x-envoy-overloaded 头信息。
...
"upstream_calls": [
    {
      "uri": "http://simple-backend:80/",
      "headers": {
        "Content-Length": "81",
        "Content-Type": "text/plain",
        "Date": "Tue, 22 Sep 2020 20:01:44 GMT",
        "Server": "envoy",
        "x-envoy-overloaded": "true"      ❶
      },
...
通过异常值检测来防范不健康的服务#
配置参考文档: https://istio.io/latest/docs/reference/config/networking/destination-rule/
kubectl apply -f ch6/simple-backend.yaml
kubectl delete destinationrule --all

kubectl apply -f ch6/simple-web-stats-incl.yaml

# 禁用整个网格的重试功能, 删除任何已配置重试的 VirtualService 资源
istioctl install --set profile=demo \
 --set meshConfig.defaultHttpRetryPolicy.attempts=0

kubectl delete vs simple-backend-vs


# 75% 的 simple-backend-1 端点调用都会以 HTTP 500 失败
kubectl apply -f ch6/simple-backend-periodic-failure-500.yaml

fortio load -H "Host: simple-web.istioinaction.io" \
-allow-initial-errors -quiet -jitter -t 30s -c 10 -qps 20 -allow-initial-errors http://192.168.8.212
Sockets used: 304 (for perfect keepalive, would be 10)
Uniform: false, Jitter: true, Catchup allowed: true
IP addresses distribution:
Code 200 : 304 (50.7 %)
Code 500 : 296 (49.3 %)

# 配置离群点检测 示例
apiVersion: networking.istio.io/v1beta1
kind: DestinationRule
metadata:
  name: simple-backend-dr
spec:
  host: simple-backend.istioinaction.svc.cluster.local
  trafficPolicy:
    outlierDetection:
      consecutive5xxErrors: 1 # 配置为 1 值。这意味着异常点检测只会在一个坏请求后跳闸
      interval: 5s # 设置指定 Istio 服务代理检查主机的频率,并根据 consecutive5xxErrors 设置决定是否弹出端点。
      baseEjectionTime: 5s # 如果服务端点被弹出,则弹出时间为 n * baseEjectionTime 。其中 n 是该端点被弹出的次数。时间结束后,该端点将重新加入负载平衡池。
      maxEjectionPercent: 100 # 上游服务负载均衡池中可被剔除的最大主机百分比。默认为10%。

kubectl apply -f ch6/simple-backend-dr-outlier-5s.yaml

fortio load -H "Host: simple-web.istioinaction.io" \
-allow-initial-errors -quiet -jitter -t 30s -c 10 -qps 20 -allow-initial-errors http://192.168.8.212
Code 200 : 581 (96.8 %)
Code 500 : 19 (3.2 %)

# 由于行为不端的端点被弹出一段时间,我们的错误率大幅降低。不过,我们仍有 19 次调用失败。为了证明这些错误是由行为不端的端点造成的,我们可以检查统计数据:

kubectl exec -it deploy/simple-web -c istio-proxy -- \
curl localhost:15000/stats | grep simple-backend | grep outlier

# simple-backend-1 主机被弹出三次。

# 添加默认重试设置,解决最后几个错误。我们可以添加默认重试设置为,总计3。
istioctl install --set profile=demo  \
  --set meshConfig.defaultHttpRetryPolicy.attempts=2

# vs 重建一下,再次执行测试
fortio load -H "Host: simple-web.istioinaction.io" \
-allow-initial-errors -quiet -jitter -t 30s -c 10 -qps 20 -allow-initial-errors http://192.168.8.212
Code 200 : 600 (100.0 %)
可观察性#
可观察性是系统的一种特性,它是通过观察系统的外部信号和特征来了解和推理系统内部状态的程度来衡量的。
文档
了解服务状态#
- Metrics 说明: https://istio.io/latest/docs/reference/config/metrics/
istio_requests_total: 从入口网关向服务发出的请求的指标istio_request_bytesistio_response_bytesistio_request_durationistio_request_duration_milliseconds
- Envoy 在识别流量时有一个内部来源和外部来源的概念。内部流量通常指来自网状网内部的流量,外部流量指来自网状网外部的流量(进入入口网关的流量)。
- 通过
cluster_name.internal.*指标,我们可以查看有多少成功请求来自内部或网状网络内部: cluster_name.ssl.*指标 , 确定流量是否通过 TLS 进入上游群集,以及与连接相关的任何其他细节(密码、曲线等等)
- 通过
- 各 Envoy cluster 指标说明: https://www.envoyproxy.io/docs/envoy/latest/configuration/upstream/cluster_manager/cluster_stats#general
cd /Users/yangzun/Desktop/istio-1.19.0

kubectl delete -f samples/addons/


# 清理
kubectl config set-context $(kubectl config current-context) \
 --namespace=istioinaction
kubectl delete virtualservice,deployment,service,\
destinationrule,gateway --all


# 部署应用
kubectl apply -f services/catalog/kubernetes/catalog.yaml
kubectl apply -f services/webapp/kubernetes/webapp.yaml
kubectl apply -f services/webapp/istio/webapp-catalog-gw-vs.yaml


# 测试
curl -H "Host: webapp.istioinaction.io" http://192.168.8.212/api/catalog

# 查看 webapp 的统计数据

kubectl exec -it deploy/webapp -c istio-proxy \
-- curl localhost:15000/stats

# 使用  pilot-agent 查看,help: pilot-agent request GET help
kubectl exec -it deploy/webapp -c istio-proxy \
 -- pilot-agent request GET stats


 # 配置代理以报告更多特使统计数据
spec:
  profile: demo
  meshConfig:
    defaultConfig:                                    ❶ 为所有服务定义默认代理配置
      proxyStatsMatcher:                              ❷ 自定义报告的指标
        inclusionPrefixes:                            ❸ 与前缀匹配的指标将与默认指标一起报告。
        - "cluster.outbound|80||catalog.istioinaction"

# 在整个网格中增加收集的度量指标可能会使度量指标收集系统超负荷,因此应该非常谨慎。更好的方法是以注释的形式按工作量指定所包含的指标。
metadata:
 annotations:
   proxy.istio.io/config: |-    ❶
     proxyStatsMatcher:
       inclusionPrefixes:
       - "cluster.outbound|80||catalog.istioinaction"

kubectl apply -f ch7/webapp-deployment-stats-inclusion.yaml

curl -H "Host: webapp.istioinaction.io" http://192.168.8.212/api/catalog

kubectl exec -it deploy/webapp -c istio-proxy \
-- curl localhost:15000/stats | grep catalog
...
cluster.outbound|80||catalog.istioinaction.svc.cluster.local.bind_errors: 0
cluster.outbound|80||catalog.istioinaction.svc.cluster.local.circuit_breakers.default.cx_open: 0
cluster.outbound|80||catalog.istioinaction.svc.cluster.local.circuit_breakers.default.cx_pool_open: 0
...

# 查询,列出代理知道的所有后端群集及其各自端点的信息
# 该查询能够输出,端点位于哪个区域、区域和子区域;以及该上游端点的任何活动请求或错误。上一组统计数据提供的是整个集群的数据。通过这组统计信息,我们可以看到每个端点的详细信息。
# https://www.envoyproxy.io/docs/envoy/latest/configuration/upstream/cluster_manager/cluster_stats#general
kubectl exec -it deploy/webapp -c istio-proxy \
-- curl localhost:15000/clusters|grep catalog
控制平面中的指标#
https://istio.io/latest/docs/reference/commands/pilot-discovery/#metrics
# 要查看控制平面指标
kubectl exec -it -n istio-system deploy/istiod -- curl localhost:15014/metrics
使用 Prometheus 抓取 Istio 指标#
# 查看 公开的 Prometheus
kubectl exec -it deploy/webapp -c istio-proxy \
-- curl localhost:15090/stats/prometheus
a安装 Prometheus 和 Grafana
cd ~/Desktop/istio-1.19.0

kubectl delete -f samples/addons/

# 使用 helm 安装 prometheus
helm repo add prometheus-community \
https://prometheus-community.github.io/helm-charts

helm repo update

kubectl create ns prometheus

helm pull prometheus-community/kube-prometheus-stack --untar

helm install prom ./kube-prometheus-stack \
-n prometheus -f kube-prometheus-stack/values-prod.yaml
创建 ServiceMonitor 监控 istio
apiVersion: monitoring.coreos.com/v1
kind: ServiceMonitor
metadata:
  name: istio-component-monitor
  namespace: prometheus
  labels:
    monitoring: istio-components
    release: prom
spec:
  jobLabel: istio
  targetLabels: [app]
  selector:
    matchExpressions:
    - {key: istio, operator: In, values: [pilot]}
  namespaceSelector:
    any: true
  endpoints:
  - port: http-monitoring
    interval: 15s

---
kubectl apply -f ch7/service-monitor-cp.yaml


kubectl -n prometheus port-forward \
statefulset/prometheus-prom-kube-prometheus-stack-prometheus 9090
配置 PodMonitor 资源,抓取包含 istio-proxy 容器的每个 Pod 的指标
apiVersion: monitoring.coreos.com/v1
kind: PodMonitor
metadata:
  name: envoy-stats-monitor
  namespace: prometheus
  labels:
    monitoring: istio-proxies
    release: prom
spec:
  selector:
    matchExpressions:
    - {key: istio-prometheus-ignore, operator: DoesNotExist}
  namespaceSelector:
    any: true
  jobLabel: envoy-stats
  podMetricsEndpoints:
  - path: /stats/prometheus
    interval: 15s
    relabelings:
    - action: keep
      sourceLabels: [__meta_kubernetes_pod_container_name]
      regex: "istio-proxy"
    - action: keep
      sourceLabels: [__meta_kubernetes_pod_annotationpresent_prometheus_io_scrape]
    - sourceLabels: [__address__, __meta_kubernetes_pod_annotation_prometheus_io_port]
      action: replace
      regex: ([^:]+)(?::\d+)?;(\d+)
      replacement: $1:$2
      targetLabel: __address__
    - action: labeldrop
      regex: "__meta_kubernetes_pod_label_(.+)"
    - sourceLabels: [__meta_kubernetes_namespace]
      action: replace
      targetLabel: namespace
    - sourceLabels: [__meta_kubernetes_pod_name]
      action: replace
      targetLabel: pod_name

---
kubectl apply -f ch7/pod-monitor-dp.yaml

# 为数据平面生成一些负载
for i in {1..100}; do curl http://192.168.8.212/api/catalog -H \
"Host: webapp.istioinaction.io"; sleep .5s;  done
标准指标
| istio_requests_total | 每个请求都会递增的 COUNTER |
|---|---|
| istio_request_duration_milliseconds | 每次请求通过时递增的计数器 |
| istio_request_bytes | 测量请求体大小的分布 |
| istio_response_bytes | 测量响应主体大小的分布 |
| istio_request_messages_total | (gRPC) 对于来自客户端的报文,计数器递增 |
| istio_response_messages_total | (gRPC) 从服务器发送的信息的 COUNTER 递增 |
Envoy 请求属性#
| 属性 | 说明 |
|---|---|
| request.path | URL 的路径部分 |
| request.url_path | 不含查询字符串的 URL 路径部分 |
| request.host | URL 的主机部分 |
| request.scheme | URL 的方案部分(如 “http) |
| request.method | 请求方法(如 “GET) |
| request.headers | 以小写标头名称为索引的所有请求标头 |
| request.referer | 请求标头 |
| request.useragent | 用户代理请求标头 |
| request.time | 收到第一个字节的时间 |
| request.id | 与x-request-id头部值对应的请求ID |
| request.protocol | 请求协议 |
其他属性
- Response
- Connection
- Upstream
- Metadata/filter state
- Wasm
配置现有指标#
# 查看已安装的 envoyfilter

kubectl get envoyfilter -n istio-system


    value:
      name: istio.stats       ❶ 过滤器名称
      typed_config:
        '@type': type.googleapis.com/udpa.type.v1.TypedStruct
        type_url: type.googleapis.com/
          envoy.extensions.filters.http.wasm.v3.Wasm
        value:
          config:             ❷ 过滤器配置
            configuration:
为现有指标增加维度
# 添加 upstream_proxy_version 和 source_mesh_id 维度
  profile: demo
  values:
    telemetry:
      v2:
        prometheus:
          configOverride:
            inboundSidecar:
              metrics:
              - name: requests_total
                dimensions:                                ❶ 新增维度
                  upstream_proxy_version: upstream_peer.istio_version
                  source_mesh_id: node.metadata['MESH_ID']
                tags_to_remove:                            ❷ 要删除的标记列表
                - request_protocol
            outboundSidecar:

istioctl install -f ch7/metrics/istio-operator-new-dimensions.yaml -y

# 让 Istio 的代理知道它。为此,我们必须使用 sidecar.istio.io/extraStatTags 注解注释部署 Pod 规范。
# 注意,该注解需要放在 spec.template.metadata Pod 模板上,而不是部署元数据本身
spec:
  replicas: 1
  selector:
    matchLabels:
      app: webapp
  template:
    metadata:
      annotations:
        proxy.istio.io/config: |-
          extraStatTags:
          - "upstream_proxy_version"
          - "source_mesh_id"
      labels:
        app: webapp

kubectl -n istioinaction apply -f \
ch7/metrics/webapp-deployment-extrastats.yaml


curl -H "Host: webapp.istioinaction.io" \
http://192.168.8.212/api/catalog

kubectl -n istioinaction exec -it deploy/webapp -c istio-proxy \
-- curl localhost:15000/stats/prometheus | grep istio_requests_total

# 您应该会看到类似下面的内容(您可能会看到两个条目:一个是入站流量,一个是出站流量):
istio_requests_total{
	...
	source_mesh_id="cluster.local",
	upstream_proxy_version="1.19.0"} 1

# 另外请注意, request_protocol 维度不在维度列表中,因为我们在之前的配置中删除了它
Istio 在 Istio 1.12 中引入了新的 Telemetry API,为用户配置度量指标提供了更多灵活性和控制。在本节中,我们使用 IstioOperator 来安装新的度量配置,但这种方法会对度量进行全局配置。如果我们想将指标配置限制在 单个命名空间或单个工作负载,可以使用新的遥测 API。
https://istio.io/latest/docs/reference/config/telemetry/#Telemetry
# 等效上面操作的示例
apiVersion: telemetry.istio.io/v1alpha1
kind: Telemetry
metadata:
  name: add-dimension-tags
  namespace: istioinaction
spec:
  metrics:
  - providers:
      - name: prometheus
    overrides:
      - match:
          metric: REQUEST_COUNT
          mode: CLIENT_AND_SERVER
        disabled: false
        tagOverrides:
          upstream_proxy_version:
            operation: UPSERT
            value: upstream_peer.istio_version
          source_mesh_id:
            operation: UPSERT
            value: node.metadata['MESH_ID']
          request_protocol:
            operation: REMOVE

kubectl apply -f ch7/metrics/v2/add-dimensions-telemetry.yaml
创建新指标#
创建一个名为istio_get_calls的新指标,但请注意我们将其定义为get_calls。如前所述,istio_前缀会自动添加。我们将此指标定义为COUNTER,但也可以选择GAUGE和HISTOGRAM。该指标的值是一个字符串,它是一个通用表达式语言(CEL;https://opensource.google/projects/cel)表达式,必须返回整数以满足COUNTER类型要求。这个CEL表达式操作属性,在这种情况下,我们计算的是HTTP GET请求的数量。
新版本中,可以使用
Telemetry(Alpha) 资源来控制指标生成,具体文档 :
# 示例, 为 stats 插件配置新的度量定义
apiVersion: install.istio.io/v1alpha1
kind: IstioOperator
spec:
  profile: demo
  values:
    telemetry:
      v2:
        prometheus:
          configOverride:
            inboundSidecar:
              definitions:
              - name: get_calls
                type: COUNTER
                value: "(request.method.startsWith('GET') ? 1 : 0)"
            outboundSidecar:
              definitions:
              - name: get_calls
                type: COUNTER
                value: "(request.method.startsWith('GET') ? 1 : 0)"
            gateway:
              definitions:
              - name: get_calls
                type: COUNTER
                value: "(request.method.startsWith('GET') ? 1 : 0)"

istioctl install -f ch7/metrics/istio-operator-new-metric.yaml -y

# pod 添加注解,在代理上公开这些 metrics
spec:
  replicas: 1
  selector:
    matchLabels:
      app: webapp
  template:
    metadata:
      annotations:
        proxy.istio.io/config: |-
          proxyStatsMatcher:
            inclusionPrefixes:
            - "istio_get_calls"
      labels:
        app: webapp

kubectl -n istioinaction apply -f \
ch7/metrics/webapp-deployment-new-metric.yaml

curl -H "Host: webapp.istioinaction.io" \
http://192.168.8.212/api/catalog

kubectl -n istioinaction exec -it deploy/webapp -c istio-proxy \
-- curl localhost:15000/stats/prometheus | grep istio_get_calls
# TYPE istio_get_calls counter
istio_get_calls{} 2
使用新属性对请求进行分组#
可以基于现有属性创建新的属性,使其更细粒度或领域特定。例如,我们可以创建一个名为istio_operationId的新属性,它将request.path_url和request.method结合起来,以尝试跟踪目录服务上/items API的GET调用次数。为此,我们使用Istio attribute-gen代理插件,这是另一个用于自定义代理指标行为的Wasm扩展。attribute-gen插件与前面一节中使用过的stats插件相辅相成。attribute-gen插件在stats插件之前进行层叠操作,以便任何它创建的属性都可以在统计数据中使用。
参考文档:
- https://istio.io/latest/docs/reference/config/networking/envoy-filter/
- https://istio.io/latest/docs/reference/config/networking/envoy-filter/
- https://istio.io/latest/zh/docs/tasks/observability/metrics/classify-metrics/
# 使用 EnvoyFilter 资源配置 attribute-gen 插件

{
  "attributes": [
    {
      "output_attribute": "istio_operationId",      ❶ 属性名称
      "match": [
        {
          "value": "getitems",                      ❷ 属性值
          "condition": "request.url_path == '/items'
            && request.method == 'GET'"
        },
}

kubectl apply -f ch7/metrics/attribute-gen.yaml

# 创建一个名为 upstream_operation 的新维度,该维度使用 istio_requests_total 指标中的属性来识别对 catalog 的 API 调用。
istioctl install -y -f ch7/metrics/istio-operator-new-attribute.yaml

# 使用新维度时,我们还需要将其添加到服务中的 extraStats 注解中
kubectl apply -f ch7/metrics/webapp-deployment-extrastats-new-attr.yaml

curl -H "Host: webapp.istioinaction.io" \
http://192.168.8.212/api/catalog

curl -H "Host: webapp.istioinaction.io" \
http://192.168.8.212/items

kubectl -n istioinaction exec -it deploy/webapp -c istio-proxy \
-- curl localhost:15000/stats/prometheus | grep istio_requests_total

kubectl exec -it deploy/webapp -c istio-proxy \
-- curl -X POST localhost:15000/reset_counters # 清理指标
Google SRE 一书[ https://sre.google/sre-book/monitoring-distributed-systems] 将以下指标称为黄金信号指标:
延迟
吞吐量
错误和饱和度
新版本中貌似一被 WasmPlugin 替代
https://istio.io/latest/zh/docs/tasks/observability/metrics/classify-metrics/
使用此种方法时,需要在 VirtualService 中指定注入
# 清理环境
kubectl config set-context $(kubectl config current-context) \
 --namespace=istioinaction
kubectl delete virtualservice,deployment,service,\
destinationrule,gateway,WasmPlugin,Telemetry --all

# 创建应用
kubectl apply -f services/catalog/kubernetes/catalog.yaml
kubectl apply -f services/webapp/kubernetes/webapp.yaml
kubectl apply -f services/webapp/istio/webapp-catalog-gw-vs.yaml

# 测试
curl -H "Host: webapp.istioinaction.io" \
http://192.168.8.212/api/catalog

---
kubectl apply -f << EOF -
apiVersion: extensions.istio.io/v1alpha1
kind: WasmPlugin
metadata:
  name: istio-attributegen-filter
  namespace: istioinaction
spec:
  selector:
    matchLabels:
      app: webapp
  url: https://storage.googleapis.com/istio-build/proxy/attributegen-359dcd3a19f109c50e97517fe6b1e2676e870c4d.wasm
  imagePullPolicy: Always
  phase: AUTHN
  pluginConfig:
    attributes:
    - output_attribute: "istio_operationId"
      match:
        - value: "ListCatalog"
          condition: "request.url_path == '/api/catalog' && request.method == 'GET'"
---
apiVersion: telemetry.istio.io/v1alpha1
kind: Telemetry
metadata:
  name: custom-tags
  namespace: istioinaction
spec:
  metrics:
    - overrides:
        - match:
            metric: REQUEST_COUNT
            mode: CLIENT_AND_SERVER
          tagOverrides:
            request_operation:
              value: istio_operationId
      providers:
        - name: prometheus
EOF


# istioctl install -y -f ch7/metrics/istio-operator-new-attribute.yaml
---

for i in $(seq 1 5);do
  curl -H "Host: webapp.istioinaction.io" http://192.168.8.212/api/catalog && echo -e "\n"
done

while true;do
	curl -H "Host: webapp.istioinaction.io" http://192.168.8.212/api/catalog && echo -e "\n" && sleep 1
done

kubectl -n istioinaction exec -it deploy/webapp -c istio-proxy \
-- curl localhost:15000/stats/prometheus | grep istio_requests_total

# DEBUG
kubectl logs deploy/webapp  -c istio-proxy | grep -e "Config Error" -e "envoy wasm"
可视化#
打开 Grafana
# 代理 Grafana , U/P: admin prom-operator
kubectl -n prometheus port-forward svc/prom-grafana 3000:80
设置 Istio 的 Grafana 仪表板#
cd ch8/

kubectl -n prometheus create cm istio-dashboards \
--from-file=pilot-dashboard.json=dashboards/pilot-dashboard.json \
--from-file=istio-workload-dashboard.json=dashboards/\
istio-workload-dashboard.json \
--from-file=istio-service-dashboard.json=dashboards/\
istio-service-dashboard.json \
--from-file=istio-performance-dashboard.json=dashboards/\
istio-performance-dashboard.json \
--from-file=istio-mesh-dashboard.json=dashboards/\
istio-mesh-dashboard.json \
--from-file=istio-extension-dashboard.json=dashboards/\
istio-extension-dashboard.json

# 将 cm 注入成  grafana_dashboard
kubectl label -n prometheus cm istio-dashboards grafana_dashboard=1
分布式追踪#
OpenTelemetry是一个由社区驱动的框架,其中包括了OpenTracing,它是一种规范,用于捕获与分布式跟踪相关的概念和API。分布式跟踪在某种程度上依赖于开发人员对其代码进行仪器化,并在应用程序处理请求并向其他系统发出新请求时进行注释。追踪引擎有助于组合请求流程的完整图像,可以用来识别我们架构中行为异常的区域。
借助 Istio,我们可以承担开发人员必须自己实现的大部分繁重工作,并提供分布式跟踪作为服务网格的一部分。
一个 Span 是表示服务或组件内的工作单元的数据集合。这些数据包括操作的开始时间、结束时间、操作名称以及一组标签和日志。
OpenTracing 实现包括如下系统:
- Jaeger
- Zipkin
- Lightstep
- Instana
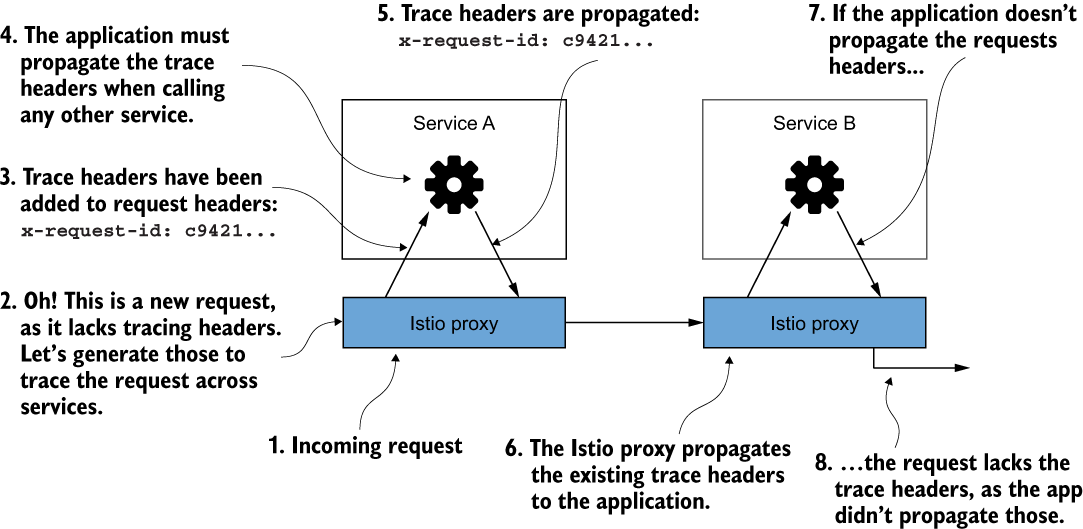
Istio 将 HTTP 标头(通常称为 Zipkin 跟踪标头)附加到请求中,可用于将后续 Span 对象与整个 Trace 相关联。如果请求进入服务并且 Istio 代理识别分布式跟踪标头,代理会将其视为正在进行的跟踪,并且不会尝试生成新的跟踪。 Istio 和分布式跟踪功能使用以下 Zipkin 跟踪标头:
x-request-idx-b3-traceidx-b3-spanidx-b3-parentspanidx-b3-sampledx-b3-flagsx-ot-span-context
Istio 无法知道哪些传出调用是哪些传入请求的结果。为了正确地将上游调用与进入服务的调用相关联,应用程序必须承担传播这些标头的责任。很多时候,开箱即用的 RPC 框架与 OpenTracing 集成或直接支持 OpenTracing,并且可以自动为您传播这些标头。无论哪种方式,应用程序都必须确保传播这些标头。
应用程序必须传播跟踪标头。否则,我们将丢失请求的完整范围。
安装分布式跟踪系统
Jaeger: Jaeger
# 从 Istio 示例目录安装示例 Jaeger 一体化部署

cd ~/Desktop/istio-1.19.0

kubectl apply -f samples/addons/jaeger.yaml

# 等待服务启动完成
kubectl get pod -n istio-system
kubectl get svc -n istio-system
可以配置 Istio 进行多个级别的分布式跟踪:全局网格、命名空间或特定工作负载。
在安装时配置跟踪
# Istio 支持分布式跟踪后端,包括 Zipkin、Datadog、Jaeger(Zipkin 兼容)等。
apiVersion: install.istio.io/v1alpha1
kind: IstioOperator
metadata:
  namespace: istio-system
spec:
  meshConfig:
    defaultConfig:
      tracing:
        lightstep: {}
        zipkin: {}
        datadog: {}
        stackdriver: {}

---
# 使用 Jaeger,它与 Zipkin 兼容,我们可以配置如下
apiVersion: install.istio.io/v1alpha1
kind: IstioOperator
metadata:
  namespace: istio-system
spec:
  meshConfig:
    defaultConfig:
      tracing:
        sampling: 100
        zipkin:
          address: zipkin.istio-system:9411

istioctl install -y -f ch8/install-istio-tracing-zipkin.yaml

# 已经安装了 Istio 并且没有配置跟踪后端,或者想要更新配置,您可以在 istioconfigmap 中的 MeshConfig 对象中看到 Istio 的网格范围默认值在 istio-system 命名空间中
kubectl get cm istio -n istio-system -o yaml
...
data:
  mesh: |-
    defaultConfig:
      discoveryAddress: istiod.istio-system.svc:15012
      proxyMetadata: {}
      tracing:
        sampling: 100
        zipkin:
          address: zipkin.istio-system:9411
    defaultProviders:
      metrics:
      - prometheus
...

# 配置工作负载的 TRACING, 下面是 Deployment 的例子
apiVersion: apps/v1
kind: Deployment
...
spec:
  template:
    metadata:
      annotations:
        proxy.istio.io/config: |
          tracing:
            zipkin:
              address: zipkin.istio-system:9411


# 检查默认 TRACING 标头
# 使用 Istio 的入口网关调用外部 httpbin 服务并调用显示请求标头的端点。

kubectl apply -n istioinaction \
-f ch8/tracing/thin-httpbin-virtualservice.yaml

curl -H "Host: httpbin.istioinaction.io" http://192.168.8.212/headers
{
  "headers": {
    "Accept": "*/*",
    "Host": "httpbin.istioinaction.io",
    "User-Agent": "curl/8.1.2",
    "X-Amzn-Trace-Id": "Root=1-65180064-39d6410b0b3e94550ef3b250",
    "X-B3-Sampled": "1",
    "X-B3-Spanid": "34914a388f45a982",
    "X-B3-Traceid": "a8440b2adfa0236034914a388f45a982",
    "X-Envoy-Attempt-Count": "1",
    "X-Envoy-Decorator-Operation": "httpbin.org:80/*",
    "X-Envoy-Internal": "true",
    "X-Envoy-Peer-Metadata": "ChoKCkNMVVNURVJfSUQSDBoKS3ViZXJuZXRlcwodCgxJTlNUQU5DRV9JUFMSDRoLMTAuNDIuNC4xMTEKGQoNSVNUSU9fVkVSU0lPThIIGgYxLjE5LjAKnAMKBkxBQkVMUxKRAyqOAwodCgNhcHASFhoUaXN0aW8taW5ncmVzc2dhdGV3YXkKEwoFY2hhcnQSChoIZ2F0ZXdheXMKFAoIaGVyaXRhZ2USCBoGVGlsbGVyCjYKKWluc3RhbGwub3BlcmF0b3IuaXN0aW8uaW8vb3duaW5nLXJlc291cmNlEgkaB3Vua25vd24KGQoFaXN0aW8SEBoOaW5ncmVzc2dhdGV3YXkKGQoMaXN0aW8uaW8vcmV2EgkaB2RlZmF1bHQKMAobb3BlcmF0b3IuaXN0aW8uaW8vY29tcG9uZW50EhEaD0luZ3Jlc3NHYXRld2F5cwoSCgdyZWxlYXNlEgcaBWlzdGlvCjkKH3NlcnZpY2UuaXN0aW8uaW8vY2Fub25pY2FsLW5hbWUSFhoUaXN0aW8taW5ncmVzc2dhdGV3YXkKLwojc2VydmljZS5pc3Rpby5pby9jYW5vbmljYWwtcmV2aXNpb24SCBoGbGF0ZXN0CiIKF3NpZGVjYXIuaXN0aW8uaW8vaW5qZWN0EgcaBWZhbHNlChoKB01FU0hfSUQSDxoNY2x1c3Rlci5sb2NhbAovCgROQU1FEicaJWlzdGlvLWluZ3Jlc3NnYXRld2F5LTU5Yzc4Njc2OGQtY2duNTUKGwoJTkFNRVNQQUNFEg4aDGlzdGlvLXN5c3RlbQpdCgVPV05FUhJUGlJrdWJlcm5ldGVzOi8vYXBpcy9hcHBzL3YxL25hbWVzcGFjZXMvaXN0aW8tc3lzdGVtL2RlcGxveW1lbnRzL2lzdGlvLWluZ3Jlc3NnYXRld2F5CicKDVdPUktMT0FEX05BTUUSFhoUaXN0aW8taW5ncmVzc2dhdGV3YXk=",
    "X-Envoy-Peer-Metadata-Id": "router~10.42.4.111~istio-ingressgateway-59c786768d-cgn55.istio-system~istio-system.svc.cluster.local"
  }
}

# 可以清楚地看到 x-b3-* Zipkin 标头自动附加到我们的请求中。这些 Zipkin 标头用于创建 Span 并发送给 Jaeger
查看分布式跟踪数据#
istioctl dashboard jaeger --browser=false
调整网格的跟踪采样
# 将服务网格中所有工作负载的全局采样率更改为 10%。
kubectl edit -n istio-system cm istio
apiVersion: v1
data:
  mesh: |-
    accessLogFile: /dev/stdout
    defaultConfig:
      discoveryAddress: istiod.istio-system.svc:15012
      proxyMetadata: {}
      tracing:
        sampling: 10
        zipkin:
          address: zipkin.istio-system:9411

# 除了全局配置之外,我们还可以在注释中针对每个工作负载进行配置。
apiVersion: apps/v1
kind: Deployment
...
spec:
  template:
    metadata:
      annotations:
        proxy.istio.io/config: |
          tracing:
            sampling: 10
            zipkin:
              address: zipkin.istio-system:9411

kubectl apply -f ch8/webapp-deployment-zipkin.yaml
来自客户端的强制追踪
在生产中,将跟踪采样率保持在 最低水平 然后在出现问题时针对每个工作负载启用它非常有意义。有时您需要启用特定跟踪的跟踪。您可以配置 Istio 以强制跟踪特定请求。
# 将 x-envoy-force-trace 标头添加到请求中,以触发 Istio 捕获请求生成的特定调用图的跨度和跟踪。
curl -H "x-envoy-force-trace: true"  \
-H "Host: webapp.istioinaction.io" http://192.168.8.212/api/catalog
每次我们发送此 x-envoy-force-trace 标头时,我们都会触发对该请求以及该请求的整个调用图的跟踪
自定义跟踪中的标签#
可以配置三种不同类型的自定义标签
- 显式指定一个值
- 从环境变量中提取值
- 从请求标头中提取值
** 注释该工作负载的 Deployment 资源**
apiVersion: apps/v1
kind: Deployment
...
spec:
  template:
    metadata:
      annotations:
        proxy.istio.io/config: |
          tracing:
            sampling: 100
            customTags:
              custom_tag:
                literal:
                  value: "Test Tag"
            zipkin:
              address: zipkin.istio-system:9411

curl -H "Host: webapp.istioinaction.io" \
http://192.168.8.212/api/catalog
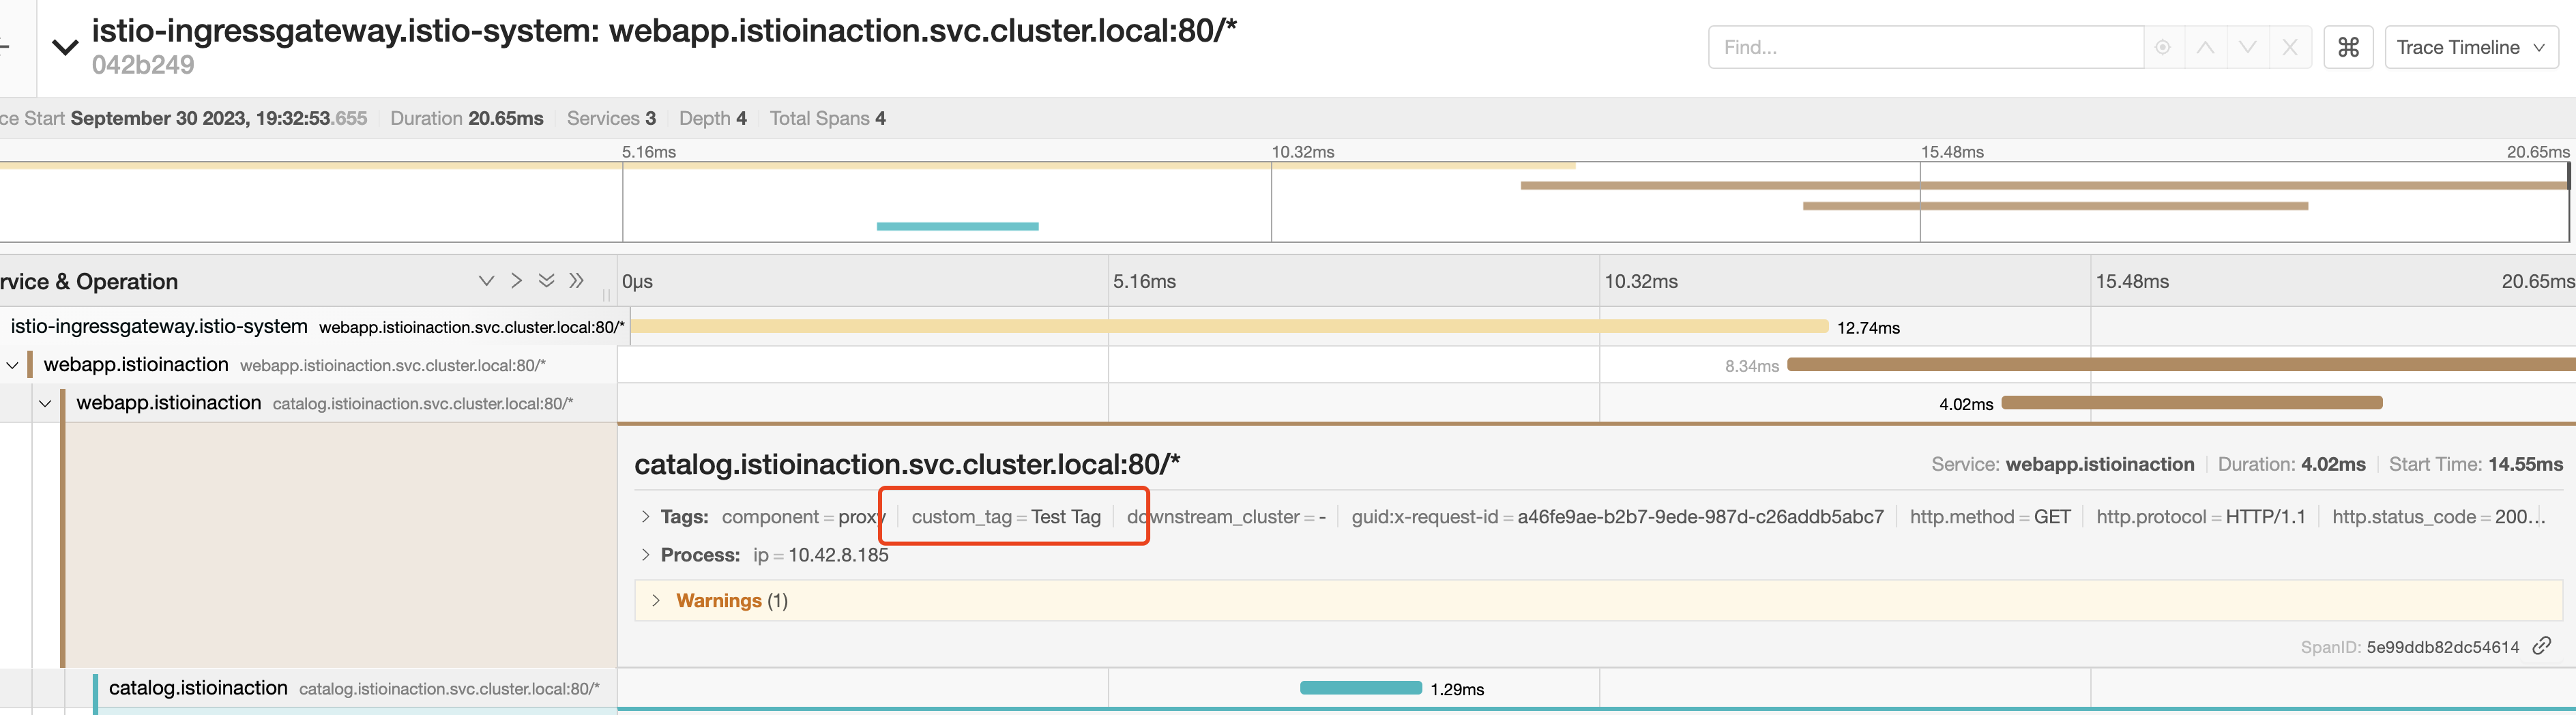
自定义标签可用于报告、过滤和以其他方式探索跟踪数据
定制后端分布式追踪引擎#
# 查看 默认跟踪配置
istioctl pc bootstrap -n istioinaction deploy/webapp \
-o json  | jq .bootstrap.tracing
{
  "http": {
    "name": "envoy.tracers.zipkin",
    "typedConfig": {
      "@type": "type.googleapis.com/envoy.config.trace.v3.ZipkinConfig",
      "collectorCluster": "zipkin",
      "collectorEndpoint": "/api/v2/spans",
      "traceId128bit": true,
      "sharedSpanContext": false,
      "collectorEndpointVersion": "HTTP_JSON"
    }
  }
}

# 跟踪引擎配置为基于Zipkin,发送到/api/v2/spans端点,并将其视为JSON端点。如果我们需要覆盖这些设置或以任何方式进行调整,则必须能够在使用Zipkin作为跟踪引擎时覆盖Istio中内置的静态定义。我们可以通过自定义启动配置来实现这一点。


# 在 Kubernetes configmap 中指定要调整的配置片段

apiVersion: v1
kind: ConfigMap
metadata:
  name: istio-custom-zipkin
data:
  custom_bootstrap.json: |
    {
      "tracing": {
        "http": {
          "name": "envoy.tracers.zipkin",
          "typedConfig": {
            "@type": "type.googleapis.com/
              envoy.config.trace.v3.ZipkinConfig",
            "collectorCluster": "zipkin",
            "collectorEndpoint": "/zipkin/api/v1/spans",
            "traceId128bit": "true",
            "collectorEndpointVersion": "HTTP_JSON"
          }
        }
      }
    }

kubectl apply -f ch8/istio-custom-bootstrap.yaml \
-n istioinaction

# 在 Deployment 资源的 Pod 模板中添加一个注解来引用这个 configmap
apiVersion: apps/v1
kind: Deployment
metadata:
  labels:
    app: webapp
  name: webapp
spec:
  replicas: 1
  selector:
    matchLabels:
      app: webapp
  template:
    metadata:
      annotations:
        sidecar.istio.io/bootstrapOverride: "istio-custom-zipkin"

kubectl apply -f ch8/webapp-deployment-custom-boot.yaml \
-n istioinaction

# 自定义引导配置与幕后使用的 Envoy 代理版本相关,并且不能保证向后兼容性。任何错误配置都可能导致的服务瘫痪。
istioctl pc bootstrap -n istioinaction deploy/webapp \
-o json | jq .bootstrap.tracing
{
  "http": {
    "name": "envoy.tracers.zipkin",
    "typedConfig": {
      "@type": "type.googleapis.com/envoy.config.trace.v3.ZipkinConfig",
      "collectorCluster": "zipkin",
      "collectorEndpoint": "/zipkin/api/v1/spans",
      "traceId128bit": true,
      "collectorEndpointVersion": "HTTP_JSON"
    }
  }
}

# Reset
kubectl apply -f services/webapp/kubernetes/webapp.yaml
使用 Kiali 进行可视化#
Istio可以与一个名为Kiali的开源项目配合使用,该项目提供了一个强大的可视化仪表板(www.kiali.io),可以帮助理解服务网格在运行时的情况。Kiali从Prometheus和底层平台中获取许多指标,并建立一个运行时图形来展示网格中各个组件之间的通信情况,以便您能够直观地了解哪些服务正在与其他服务进行通信。您还可以与图形进行交互,并深入研究可能存在问题的区域,以更多地了解发生了什么。Kiali不同于Grafana,它专注于构建一个有向图,展示服务之间如何相互交互并实时更新指标。Grafana非常擅长创建具有刻度、计数器、图表等功能的仪表板,但不能呈现集群中服务的交互式绘图或地图。
安装 Kiali#
使用 helm 安装
kubectl create ns kiali-operator

helm repo add kiali https://kiali.org/helm-charts

helm repo update

helm pull kiali/kiali-operator  --untar

cat > kiali-operator/values-prod.yaml << EOF
cr:
  create: false
  name: kiali
  namespace: "istio-system"
EOF

helm upgrade --install kiali-operator -f \
  ./kiali-operator/values-prod.yaml  \
  -n kiali-operator ./kiali-operator
---
# 创建 kiali 实例
# 配置模板 https://github.com/kiali/kiali-operator/blob/master/crd-docs/cr/kiali.io_v1alpha1_kiali.yaml
kubectl apply -f << EOF -
apiVersion: kiali.io/v1alpha1
kind: Kiali
metadata:
  namespace: istio-system
  name: kiali
spec:
  istio_namespace: "istio-system"
  istio_component_namespaces:
    prometheus: prometheus
  auth:
    strategy: anonymous
  deployment:
    accessible_namespaces:
    - '**'
  external_services:
    prometheus:
      cache_duration: 10
      cache_enabled: true
      cache_expiration: 300
      url: "http://prom-kube-prometheus-stack-prometheus.prometheus:9090"
    tracing:
      enabled: true
      in_cluster_url: "http://tracing.istio-system:16685/jaeger"
      use_grpc: true
EOF


# 代理至本地
kubectl -n istio-system port-forward deploy/kiali 20001

# 创建 token
kubectl -n istio-system create token kiali-service-account


# 创建数据
for i in {1..20}; do curl http://192.168.8.212/api/catalog -H \
"Host: webapp.istioinaction.io"; sleep .5s;  done
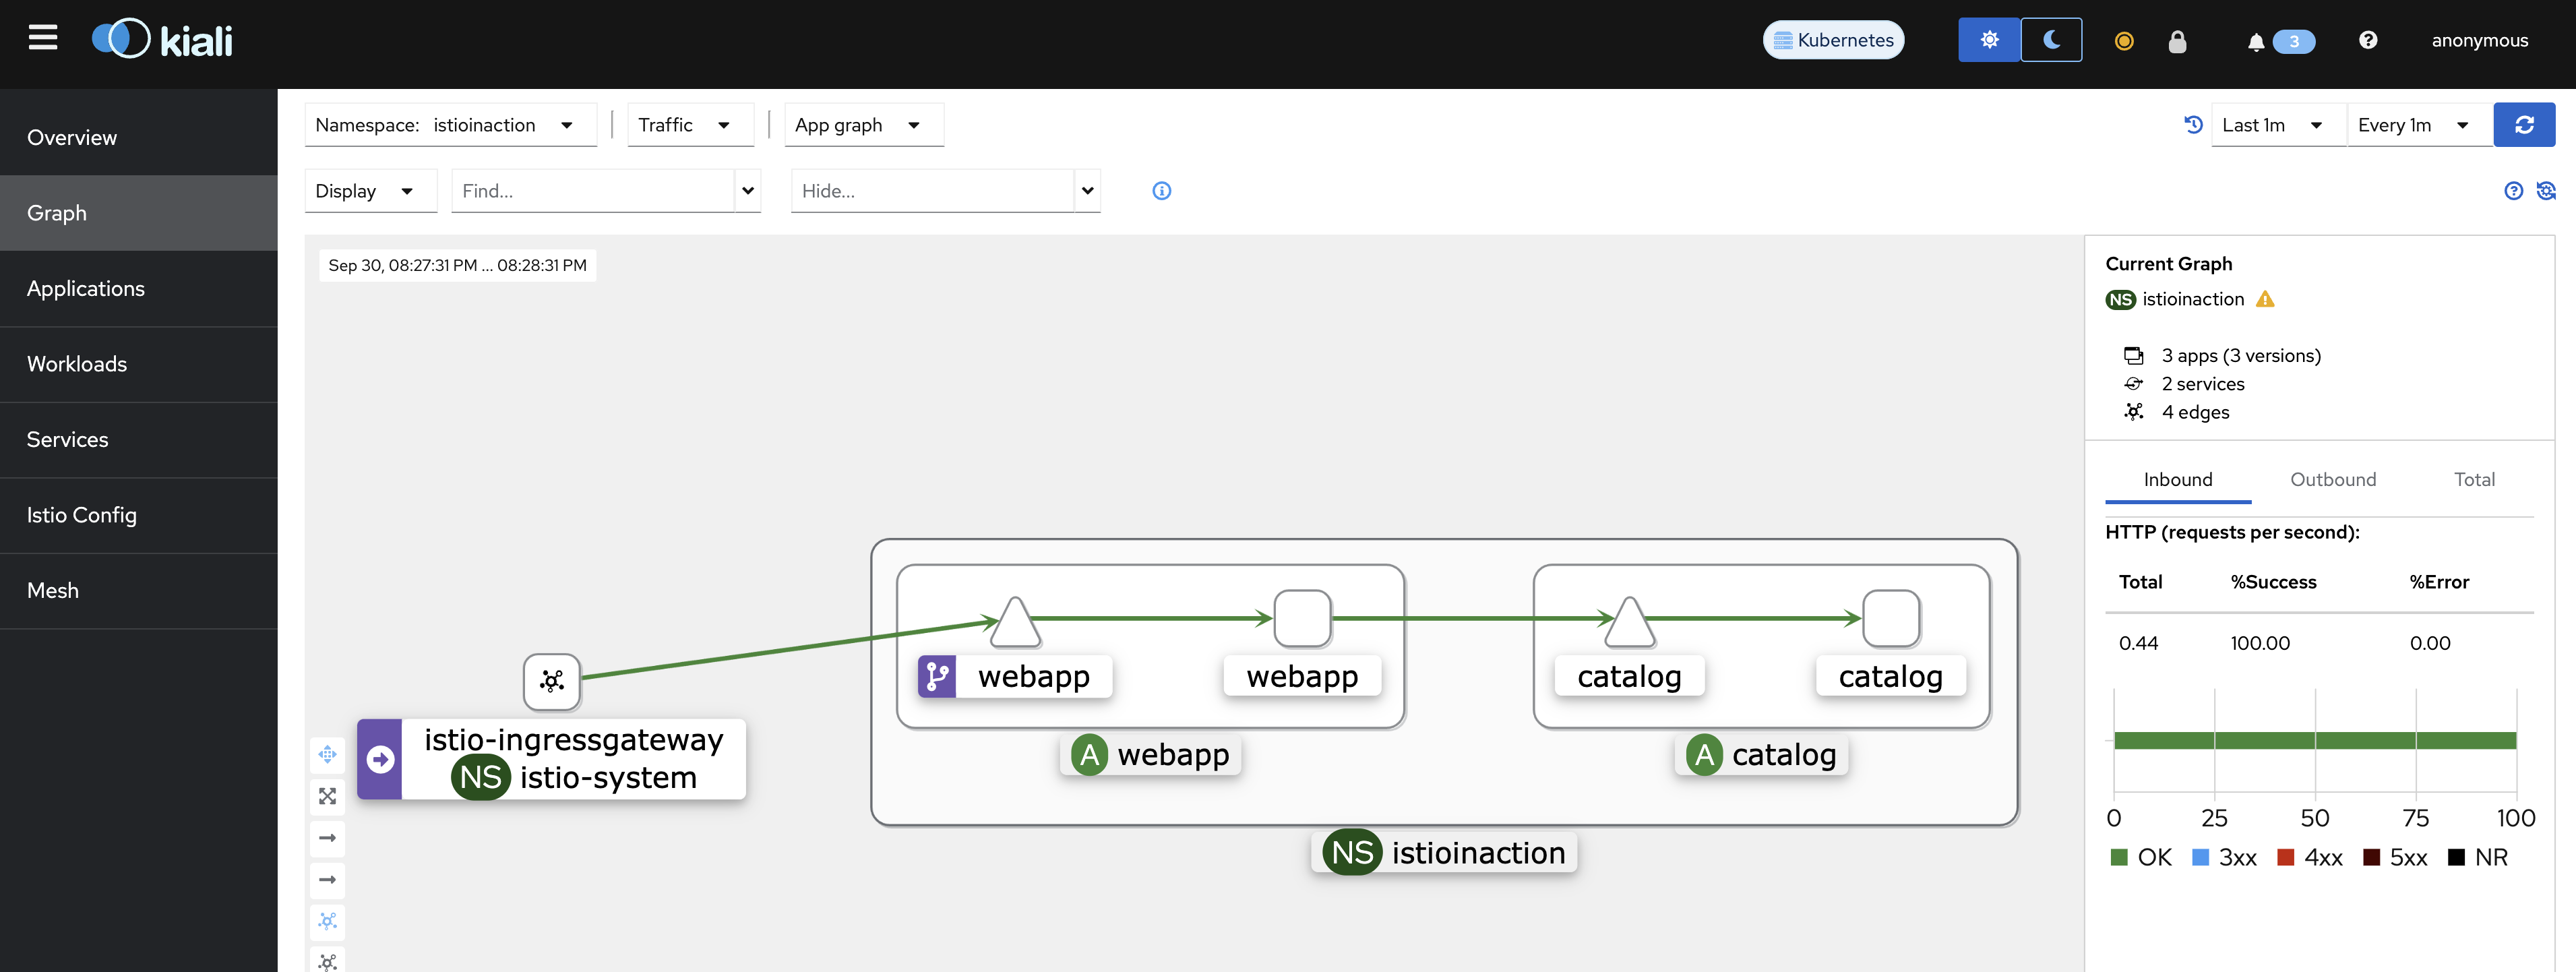
跟踪、指标和日志的关联#
Kiali正在逐渐发展成为一个能回答所有服务网格可观察性问题的仪表板。其中之一的Kiali功能——关联跟踪、指标和日志——只是未来可能性的一个承诺。
查看遥测数据之间的相关性
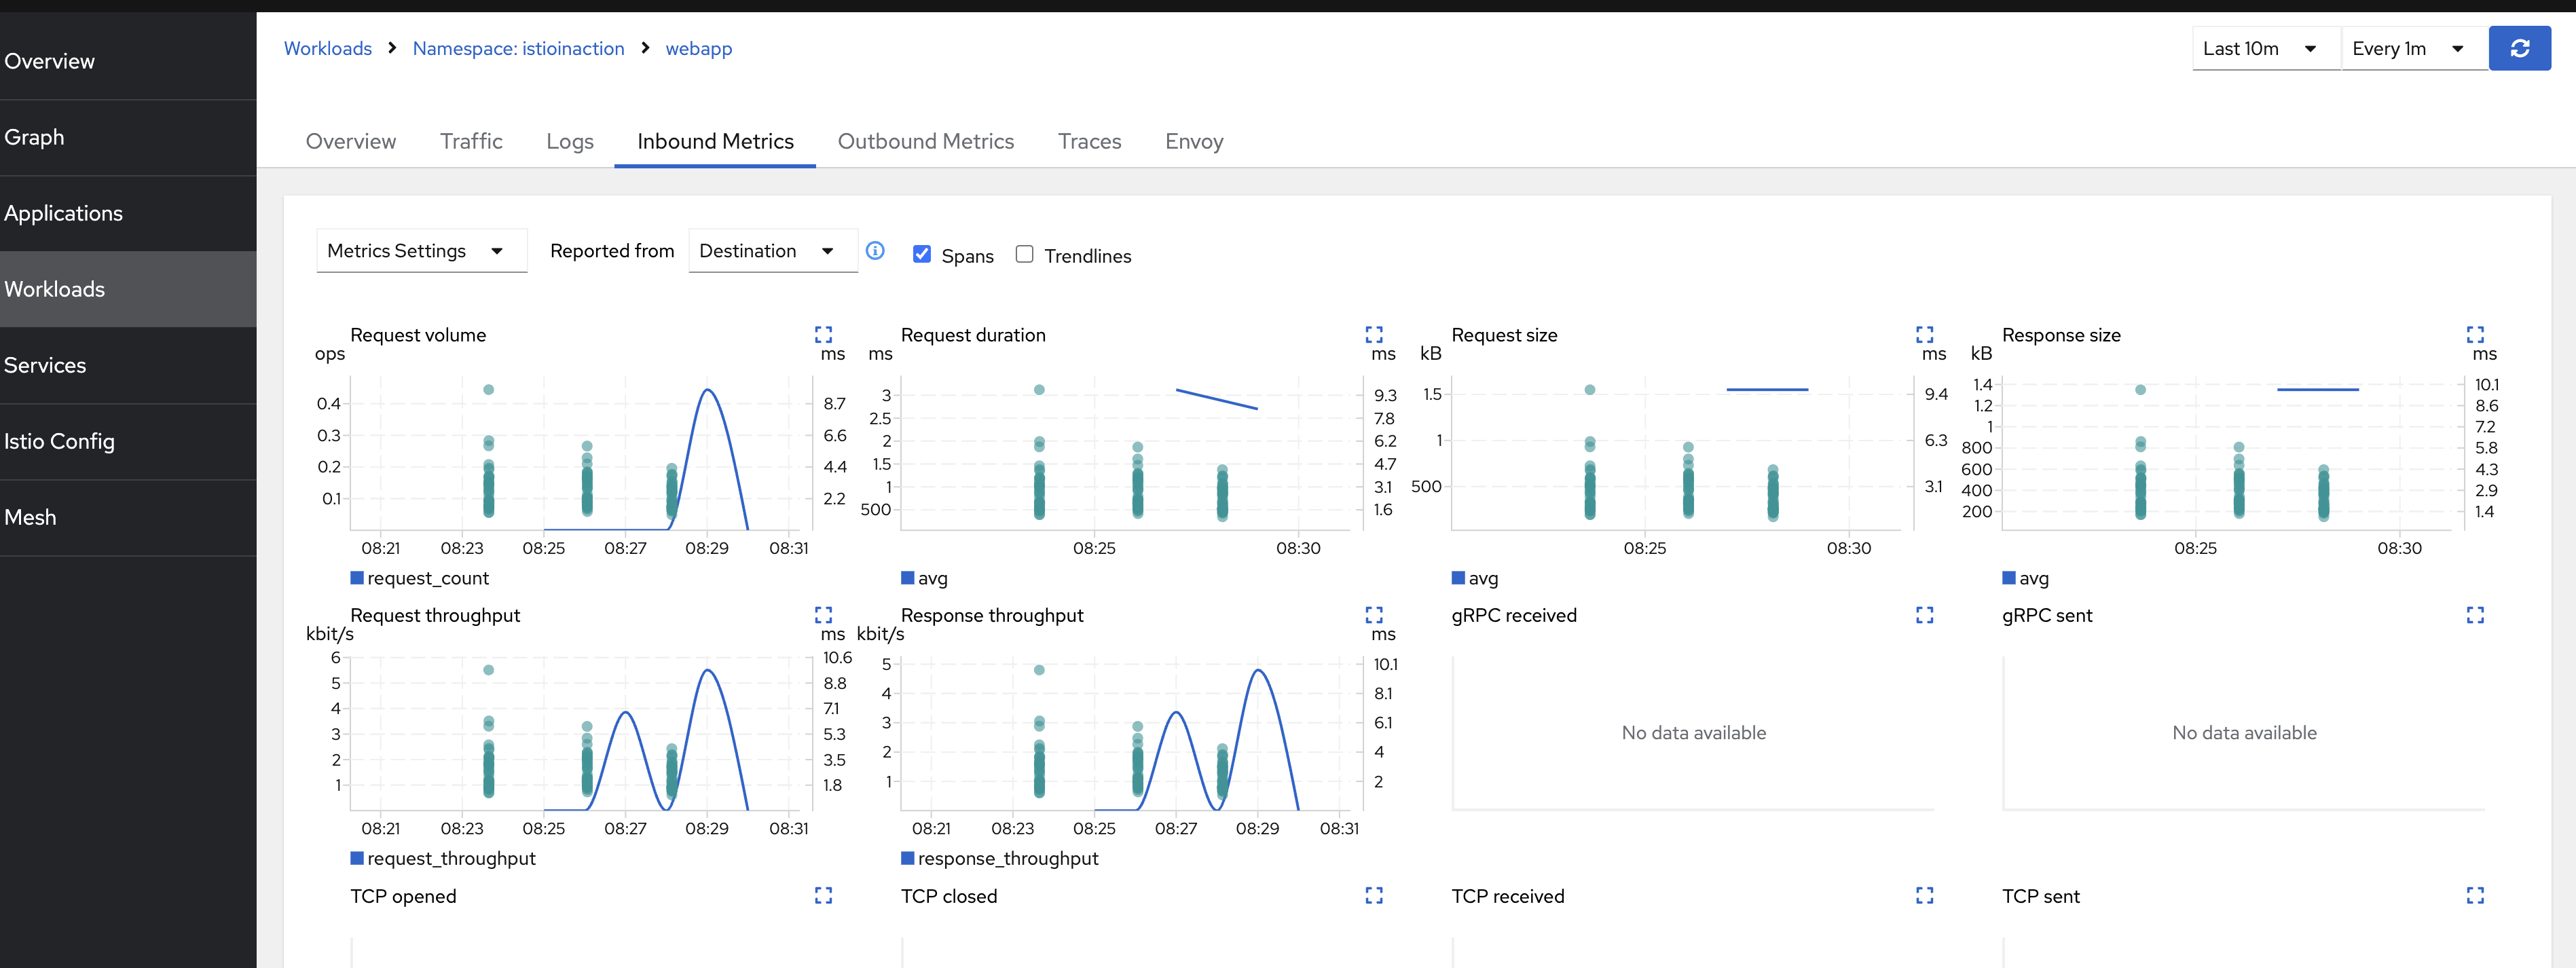
选项卡说明
- Logs: 应用程序日志、Envoy访问日志和相关的跨度
- Inbound Metrics and Outbound Metrics: 与跨度相关
- Traces: Jaeger 报告 的追踪
- Envoy: 应用于工作负载的Envoy配置,如集群、监听器和路由
了解 Kiali 工作负载与应用程序
在 Kiali 中, 您会注意到工作负载和应用程序之间的区别。对于我们的示例应用程序,它们实际上是相同的,但两者之间的最大区别是:
- 工作负载是一个运行的二进制文件,可以部署为一组相同的运行副本。例如,在 Kubernetes 中,这将是部署的 Pod 部分。具有三个副本的服务部署将是一个工作负载。
- 一个应用是
一组工作负载和相关构件,如服务和配置。在Kubernetes中,这可能是一个服务A以及一个服务B和可能的数据库。每个都将成为自己的工作负载,并且它们共同组成了一个Kiali 应用程序。
Kiali 对于服务网格 管理人员很有用,因为它可以验证以下 Istio 资源
- VirtualService 指向不存在的 Gateway
- 路由到不存在的目的地
- 同一主机有多个 VirtualService
- 未找到服务子集
关于更多 kiali 检查问题: https://kiali.io/docs/features/validations/
关于保障微服务安全#
应用程序安全性包括有助于保护具有关键价值的应用程序数据的所有活动,这些数据不应被破坏、窃取或被未经授权的用户访问。为了保护用户数据,我们需要:
- 在允许访问资源之前对用户进行身份验证和授权
- 对传输中的数据进行加密,以防止数据在通过多个网络设备到达请求数据的客户端时被窃听
- 服务间认证: (SPIFFE) 框架提供一种自动化的方式来发布服务身份。颁发的身份用于服务之间的相互验证。
- 最终用户认证: 用户将此凭证提供给服务进行身份验证。在允许任何类型的访问之前,服务会使用颁发凭证的身份验证服务器来验证凭证( HTTP cookie 或 JSON Web 令牌 [JWT] 等 )
- 授权
SPIFFE 规范
SPIFFE 是一组开源标准,用于为高度动态和异构环境中的工作负载提供身份
- https://spiffe.io/docs/latest/spire-about/
- SPIFFE 身份是一个符合 RFC 3986 的 URI,以 spiffe://trust-domain/path 格式组成
- 信任域代表身份的颁发者,例如个人或组织。
- 该路径唯一标识信任域内的工作负载。
Istio 使用运行特定工作负载的服务帐户来填充此路径。此 SPIFFE 身份编码在 X.509 证书中,也称为 SPIFFE 可验证身份文档 (SVID),由 Istio 的控制平面为工作负载铸造。然后,这些证书用于通过加密传输中的数据来保护服务到服务通信的传输。
Istio 定义的自定义资源来配置服务代理
PeerAuthentication资源配置代理以验证服务到服务的流量。身份验证成功后,代理会提取对等方证书中编码的信息,并使其可用于授权请求。RequestAuthentication资源将代理配置为针对颁发最终用户凭据的服务器进行身份验证。身份验证成功后,它还会提取凭证中编码的信息,并使其可用于授权请求。AuthorizationPolicy资源将代理配置为根据前两个资源提取的数据做出决策来授权或拒绝请求。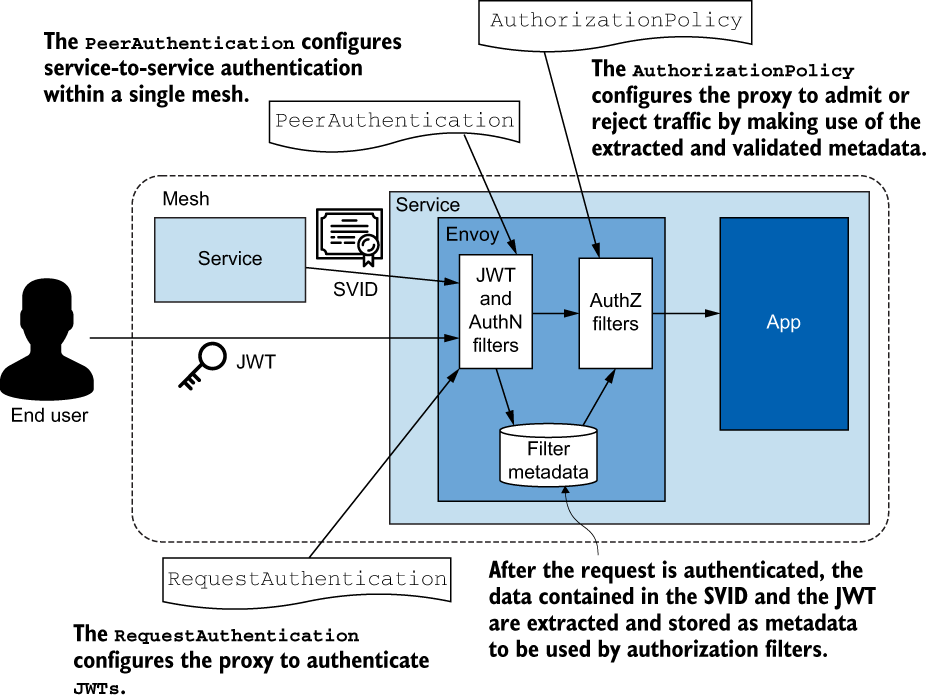
展示了PeerAuthentication和RequestAuthentication资源如何配置代理以对请求进行身份验证,此时将编码到凭据(SVID或JWT)中的数据提取并存储为过滤器元数据。过滤器元数据表示连接身份。AuthorizationPolicy资源根据其连接身份决定是否允许或拒绝请求。
自动 mTLS#
对服务进行身份验证使我们能够遵守最小特权原则,为每个服务创建策略,并仅允许其功能所需的最低访问权限。这非常重要,因为当代表服务身份的证书最终落入坏人之手时,损害范围仅限于允许该身份访问的少数服务。
工作负载使用 Istio 证书颁发机构颁发的 SVID 证书进行相互身份验证。
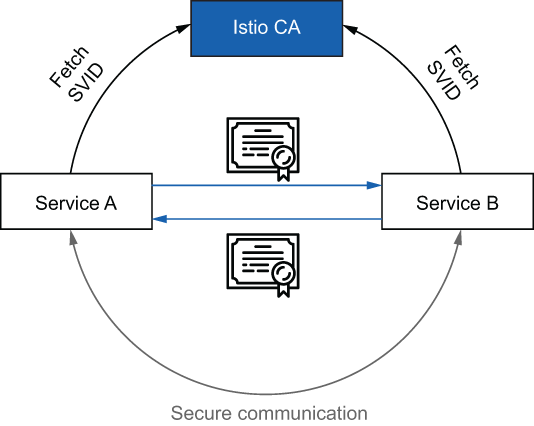
环境搭建#
kubectl config set-context $(kubectl config current-context) \
 --namespace=istioinaction

kubectl delete virtualservice,deployment,service,\
destinationrule,gateway --all


# 设置的三个工作负载
kubectl label namespace istioinaction istio-injection=enabled
kubectl apply -f services/catalog/kubernetes/catalog.yaml
kubectl apply -f services/webapp/kubernetes/webapp.yaml
kubectl apply -f services/webapp/istio/webapp-catalog-gw-vs.yaml
kubectl apply -f ch9/sleep.yaml -n default


# 从 sleep 工作负载到 webapp 工作负载的明文请求,验证服务是否已正确设置
kubectl -n default exec deploy/sleep -c sleep -- \
     curl -s webapp.istioinaction/api/catalog \
     -o /dev/null -w "%{http_code}"
200

# 使用 PeerAuthentication 可以禁止明文流量
PeerAuthentication 资源#
https://istio.io/latest/docs/reference/config/security/peer_authentication/
PeerAuthentication资源允许将工作负载配置为严格要求 mTLS 或宽松并接受明文流量,分别使用STRICT或PERMISSIVE身份验证模式。相互认证模式可以在不同范围内配置:
- 网格范围的
PeerAuthentication策略适用于服务网格的所有工作负载。- 命名空间范围的
PeerAuthentication策略适用于命名空间中的所有工作负载。- 特定于工作负载的
PeerAuthentication策略适用于与策略中指定的选择器匹配的所有工作负载。
使用网格范围策略拒绝所有未经身份验证的流量
创建强制执行
STRICT相互身份验证模式的网格范围策略来禁止明文流量。PeerAuthentication 策略必须满足两个条件:它必须应用在
Istio 安装命名空间中,并且必须命名为default
apiVersion: "security.istio.io/v1beta1"
kind: "PeerAuthentication"
metadata:
  name: "default"                ❶ 网格范围内的策略必须命名为“default”。
  namespace: "istio-system"      ❷ Istio安装命名空间
spec:
  mtls:
    mode: STRICT                 ❸  双向 TLS 模式

kubectl apply -f ch9/meshwide-strict-peer-authn.yaml

#  此时未在 istio 网格中的服务,将被禁止
kubectl -n default exec deploy/sleep -c sleep -- \
     curl -s webapp.istioinaction/api/catalog
000command terminated with exit code 56
允许非相互验证的流量#
使用命名空间范围的策略,我们可以覆盖网格范围的策略。
此操作为不推荐做法,无法保证攻击面做到最小,应该针对 特定 workload 授权
apiVersion: "security.istio.io/v1beta1"
kind: "PeerAuthentication"
metadata:
  name: "default"              ❶ 使用“默认”命名约定,以便仅存在一个名称空间范围的资源
  namespace: "istioinaction"   ❷ 指定应用策略的命名空间
spec:
  mtls:
    mode: PERMISSIVE           ❸ PERMISSIVE 允许 HTTP 流量。
应用特定于工作负载的对等身份验证策略
apiVersion: "security.istio.io/v1beta1"
kind: "PeerAuthentication"
metadata:
  name: "webapp"
  namespace: "istioinaction"
spec:
  selector:
    matchLabels:
      app: "webapp"      ❶ 与标签匹配的工作负载使用 mTLS 的 PERMISSIVE 模式。
  mtls:
    mode: PERMISSIVE

kubectl apply -f ch9/workload-permissive-peer-authn.yaml

kubectl -n default exec deploy/sleep -c sleep -- \
     curl -I -s webapp.istioinaction/api/catalog
HTTP/1.1 200 OK
...
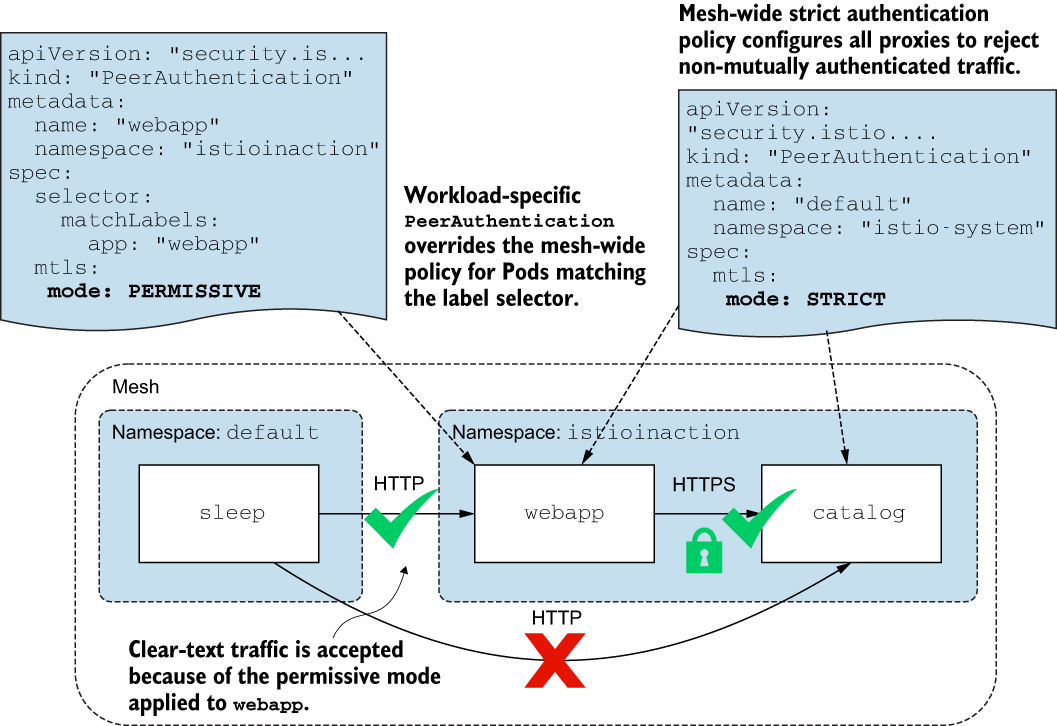
istiod 监听 PeerAuthentication 资源的创建,将资源转换为 Envoy-特定配置,并使用侦听器发现服务 (LDS) 将其应用到服务代理。针对每个传入请求评估配置的策略。
两种额外的相互验证模式#
大多数时候,您将使用
STRICT或PERMISSIVE模式。但还有两种额外的模式
UNSET— 继承父级的PeerAuthentication策略。DISABLE——不要通过隧道传输流量;直接将其发送到服务。
TCPDUMP 流量窃听#
# Istio 代理预装了 tcpdump 命令行实用程序。默认情况下,这些都是关闭的。
istioctl install -y --set profile=demo \
     --set values.global.proxy.privileged=true

# 更新了 Istio 以注入特权 sidecar 代理。需要重新创建 webapp 工作负载。
kubectl delete po -l app=webapp -n istioinaction

# 执行以下 tcpdump 命令来嗅探 Pod 流量
kubectl -n istioinaction exec deploy/webapp -c istio-proxy \
     -- sudo tcpdump -l --immediate-mode -vv -s 0 \
     '(((ip[2:2] - ((ip[0]&0xf)<<2)) - ((tcp[12]&0xf0)>>2)) != 0)'

# 触发从 sleep 工作负载到 webapp 的请求
kubectl -n default exec deploy/sleep -c sleep -- \
     curl -s webapp.istioinaction/api/catalog

    webapp-6c89558f4c-8n4vn.http-alt > 10-42-8-191.sleep.default.svc.cluster.local.50240: Flags [P.], cksum 0x2b70 (incorrect -> 0x0c5b), seq 1:1398, ack 94, win 128, options [nop,nop,TS val 3429114437 ecr 3550089041], length 1397: HTTP, length: 1397
        HTTP/1.1 200 OK
        content-length: 357
...

# 会看到信息在集群内传输是明文的
验证工作负载身份是否与工作负载服务帐户绑定
kubectl -n istioinaction exec deploy/webapp -c istio-proxy \
     -- openssl s_client -showcerts \
     -connect catalog.istioinaction.svc.cluster.local:80 \
     -CAfile /var/run/secrets/istio/root-cert.pem | \
     openssl x509 -in /dev/stdin -text -noout
...
          X509v3 Subject Alternative Name: critical
                URI:spiffe://cluster.local/ns/istioinaction/sa/catalog
...


# 使用 openssl verify 实用程序,我们通过根据证书颁发机构 (CA) 根证书检查其签名来确保 X.509 SVID 的内容有效
kubectl -n istioinaction exec -it \
     deploy/webapp -c istio-proxy -- /bin/bash

openssl verify -CAfile /var/run/secrets/istio/root-cert.pem \
     <(openssl s_client -connect \
     catalog.istioinaction.svc.cluster.local:80 -showcerts 2>/dev/null)

/dev/fd/63: OK
授权服务到服务的流量#
https://istio.io/latest/docs/reference/config/security/authorization-policy
# 示例 AuthorizationPolicy 定义
apiVersion: "security.istio.io/v1beta1"
kind: "AuthorizationPolicy"
metadata:
  name: "allow-catalog-requests-in-web-app"
  namespace: istioinaction
spec:
  selector:
    matchLabels:
      app: webapp
  action: ALLOW
  rules:
  - to:
    - operation:
        paths: ["/api/catalog*"]

当 istiod 发现新的 AuthorizationPolicy 已应用于集群时,它会使用该资源处理和更新数据平面代理,就像其他 Istio 资源一样。
授权策略的属性
selector字段定义应用策略的工作负载子集。action字段指定这是否是ALLOW、DENY或CUSTOM策略。rules字段定义了一个规则列表,用于标识将激活策略的请求。
授权政策规则
from字段指定请求的来源,可以是以下类型之一principals— 源身份列表(SPIFFE ID,如 mTLS 示例中所示)。namespaces—与源命名空间匹配的命名空间列表。ipBlocks— 使用与源 IP 地址匹配的无类域间路由 (CIDR) 的单个 IP 地址或范围的列表。
to字段指定请求的操作,例如请求的主机或方法。when字段指定规则匹配后需要满足的条件列表。
kubectl config set-context $(kubectl config current-context) \
 --namespace=istioinaction
kubectl delete virtualservice,deployment,service,\
destinationrule,gateway --all

kubectl apply -f services/catalog/kubernetes/catalog.yaml
kubectl apply -f services/webapp/kubernetes/webapp.yaml
kubectl apply -f services/webapp/istio/webapp-catalog-gw-vs.yaml
kubectl apply -f ch9/sleep.yaml -n default

# webapp 工作负载部署在 istioinaction 命名空间中,并接受来自 default 命名空间中工作负载的未经身份验证的请求。
# catalog 工作负载部署在 istioinaction 命名空间中,并且仅接受来自同一命名空间中经过身份验证的工作负载的请求。
kubectl apply -f ch9/meshwide-strict-peer-authn.yaml
kubectl apply -f ch9/workload-permissive-peer-authn.yaml
基于URL的授权
kubectl apply -f ./ch9/allow-catalog-requests-in-web-app.yaml

kubectl -n default exec deploy/sleep -c sleep -- \
      curl -sSL webapp.istioinaction/api/catalog

kubectl -n default exec deploy/sleep -c sleep -- \
      curl -sSL webapp.istioinaction/hello/world
RBAC: access denied
注意
- 如果一个工作负载有ALLOW策略,则必须进行匹配才能允许流量通过。其他流量均会被 deny
- 建议添加一个
拒绝所有流量的策略,考虑需要接受的流量,并为其创建策略。
# 拒绝所有未明确指定 ALLOW 策略的请求,  deny-all 策略
apiVersion: security.istio.io/v1beta1
kind: AuthorizationPolicy
metadata:
 name: deny-all
 namespace: istio-system     ❶
spec: {}                     ❷

kubectl -n default exec deploy/sleep -c sleep -- \
     curl -sSL webapp.istioinaction/api/catalog

kubectl delete -f ./ch9/allow-catalog-requests-in-web-app.yaml

kubectl -n default exec deploy/sleep -c sleep -- \
     curl -sSL webapp.istioinaction/api/catalog
RBAC: access denied


# 下内容默认允许所有请求
apiVersion: security.istio.io/v1beta1
kind: AuthorizationPolicy
metadata:
  name: allow-all
  namespace: istio-system
spec:
  rules:
  - {}
允许来自单个命名空间的请求#
使用前提,源流量需要在
网格中
apiVersion: "security.istio.io/v1beta1"
kind: "AuthorizationPolicy"
metadata:
 name: "webapp-allow-view-default-ns"
 namespace: istioinaction              ❶ istioinaction 中的工作负载
spec:
  rules:
  - from:                              ❷ 源自默认命名空间的源
    - source:
        namespaces: ["default"]
    to:                                ❸ 仅适用于HTTP GET方法
    - operation:
        methods: ["GET"]
允许来自未经身份验证流量,访问单个工作负载#
# 删除了 from 字段

apiVersion: "security.istio.io/v1beta1"
kind: "AuthorizationPolicy"
metadata:
 name: "webapp-allow-unauthenticated-view"
 namespace: istioinaction
spec:
  selector:
    matchLabels:
      app: webapp
  rules:
  - to:
    - operation:
        methods: ["GET"]

kubectl -n default exec deploy/sleep -c sleep -- \
     curl -sSL webapp.istioinaction/api/catalog
允许来自单个 SA 账号的请求#
apiVersion: "security.istio.io/v1beta1"
kind: "AuthorizationPolicy"
metadata:
 name: "catalog-viewer"
 namespace: istioinaction
spec:
 selector:
   matchLabels:
     app: catalog
 rules:
 - from:
   - source:
       principals: ["cluster.local/ns/istioinaction/sa/webapp"]    ❶ 允许带有webapp身份的请求
   to:
   - operation:
       methods: ["GET"]

kubectl -n default exec deploy/sleep -c sleep -- \
      curl -sSL webapp.istioinaction/api/catalog
策略的条件匹配#
# 当用户是管理员时允许所有操作。
apiVersion: "security.istio.io/v1beta1"
kind: "AuthorizationPolicy"
metadata:
  name: "allow-mesh-all-ops-admin"
  namespace: istio-system
spec:
  rules:
    - from:
      - source:
          requestPrincipals: ["auth@istioinaction.io/*"]
      when:
      - key: request.auth.claims[group]     ❶ 指定Istio属性
        values: ["admin"]                   ❷ 指定必须匹配的值列表

# 此策略仅在满足两个条件时才允许请求:首先,令牌是由请求主体 auth@istioinaction.io/* 颁发的;其次,JWT 包含值为 admin 的组声明。
principals 和 requestPrincipals 。区别
- https://istio.io/latest/docs/reference/config/security/authorization-policy/#Source
principals是来自PeerAuthentication配置的 mTLS 连接的对等方,而requestPrincipals用于最终用户RequestAuthentication来自 JWT- 是用于定义哪些主体有权访问服务或资源的全局身份标识,通常在策略配置中定义。
Principals是用于定义哪些主体有权访问服务或资源的全局身份标识,通常在策略配置中定义。RequestPrincipals是在请求级别确定的主体身份,用于在请求到达服务时进行更细粒度的访问控制决策。这些可以基于请求中的信息动态计算。
暂时跳过此章节部分
数据平面故障排除#
kubectl config set-context $(kubectl config current-context) \
 --namespace=istioinaction
kubectl delete virtualservice,deployment,service,\
destinationrule,gateway,authorizationpolicy,peerauthentication --all
kubectl delete authorizationpolicy,peerauthentication --all -n istio-system

kubectl apply -f services/catalog/kubernetes/catalog.yaml
kubectl apply -f ch10/catalog-deployment-v2.yaml
kubectl apply -f ch10/catalog-gateway.yaml
kubectl apply -f ch10/catalog-virtualservice-subsets-v1-v2.yaml

for i in {1..100}; do curl http://192.168.8.212/items \
-H "Host: catalog.istioinaction.io" \
-w "\nStatus Code %{http_code}\n"; sleep .5s;  done
检查数据平面是否与最新配置同步#
istioctl proxy-status
同步状态
SYNCED-特使已确认控制平面发送的最后一个配置。NOT SENT-控制平面没有向 Envoy 发送任何信息。这通常是因为控制平面没有东西要发送。路由发现服务(RDS)的istio-egressgateway就是这种情况。STALE-控制平面istiod已发送更新,但未确认。这表明以下情况之一:控制平面超载;Envoy 与控制平面之间缺乏连接或连接中断;或 Istio 存在错误。
利用 Kiali 发现错误配置#
istioctl dashboard kiali
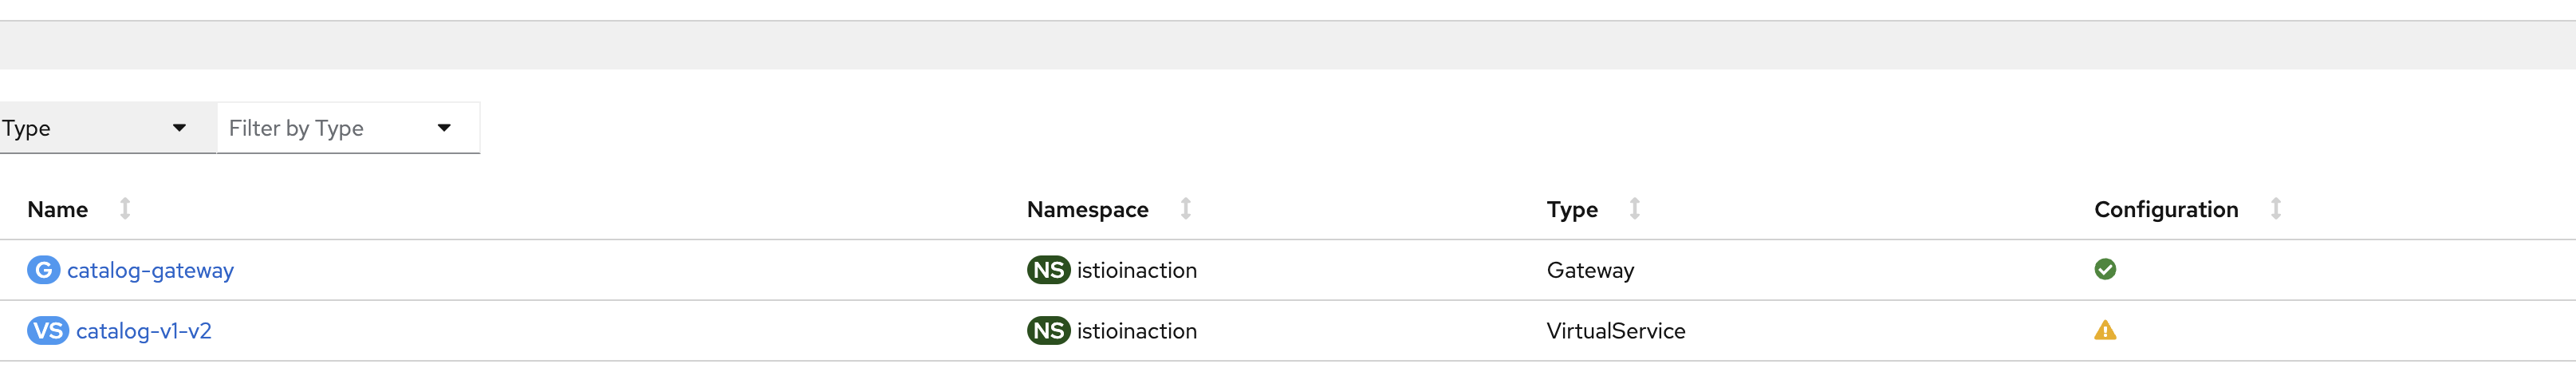
使用 istioctl 发现错误配置
istioctl analyze
istioctl describe

# 分析一下 istioinaction 命名空间
Error [IST0101] (VirtualService istioinaction/catalog-v1-v2) Referenced host+subset in destinationrule not found: "catalog.istioinaction.svc.cluster.local+version-v1"
Error [IST0101] (VirtualService istioinaction/catalog-v1-v2) Referenced host+subset in destinationrule not found: "catalog.istioinaction.svc.cluster.local+version-v2"

istioctl x describe pod catalog-5df8455c79-rk4l9
VirtualService: catalog-v1-v2
   WARNING: No destinations match pod subsets (checked 1 HTTP routes)
      Warning: Route to subset version-v1 but NO DESTINATION RULE defining subsets!
      Warning: Route to subset version-v2 but NO DESTINATION RULE defining subsets!
从 Envoy 配置中手动发现错误配置#
https://www.envoyproxy.io/docs/envoy/v1.20.1/operations/admin
istioctl dashboard envoy deploy/catalog -n istioinaction
使用 istioctl 查询 envoy 代理配置#
通过
istioctl proxy-config命令,我们可以根据 Envoy xDS API 检索和过滤工作负载的代理配置,其中每个子命令都有适当的名称:
cluster-读取群集配置endpoint-读取端点配置listener-读取监听器配置route-检索路由配置secret-读取秘密配置
istioctl proxy-config listeners \
     deploy/istio-ingressgateway -n istio-system
ADDRESSES PORT  MATCH DESTINATION
0.0.0.0   8080  ALL   Route: http.8080 #  8080 端口上的请求根据路由 http.8080 进行路由配置。
0.0.0.0   15021 ALL   Inline Route: /healthz/ready*
0.0.0.0   15090 ALL   Inline Route: /stats/prometheus*

# 在 8080 端口上配置了一个监听器。
# 流量将根据名为 http.8080 的路由进行路由,该监听器的路由名为 http.8080。

 kubectl -n istio-system get svc istio-ingressgateway -o yaml \
| grep "ports:" -A 10


# http.8080 路由的流量被路由到哪些应用
istioctl pc routes deploy/istio-ingressgateway \
      -n istio-system --name http.8080

# 按 Json 打印,将会更详细
istioctl pc routes deploy/istio-ingressgateway -n istio-system \
      --name http.8080 -o json

# 查询 ENVOY 群组配置
istioctl proxy-config clusters \
     deploy/istio-ingressgateway.istio-system \
     --fqdn catalog.istioinaction.svc.cluster.local  \
     --port 80 \
     --subset version-v1

# 找到请求会失败原因,因为 VirtualService 会路由到不存在的群组。

istioctl analyze ch10/catalog-destinationrule-v1-v2.yaml \
    -n istioinaction

# 修复问题
kubectl apply -f ch10/catalog-destinationrule-v1-v2.yaml

# 再次查询聚类,我们应该会看到新定义的 version-v1 和 version-v2 子集:
istioctl pc clusters deploy/istio-ingressgateway -n istio-system \
     --fqdn catalog.istioinaction.svc.cluster.local --port 80

# 查询 ENVOY 群组端点,群组端点可以使用上面的 "查询 ENVOY 群组配置" 获取到。
istioctl pc endpoints deploy/istio-ingressgateway -n istio-system \
--cluster "outbound|80|version-v1|catalog.istioinaction.svc.cluster.local"

# 安装端点IP 查询属于哪个 pod
kubectl get pods -n istioinaction \
    --field-selector status.podIP=10.42.8.208
NAME                       READY   STATUS    RESTARTS   AGE
catalog-5df8455c79-rk4l9   2/2     Running   0          29m
排除应用程序问题#
对于基于微服务的应用程序来说,服务代理生成的日志和指标有助于排除许多问题,如发现导致
性能瓶颈的服务、识别经常出现故障的端点、检测性能下降等。
# 设置会超时的间歇性慢速工作负载

CATALOG_POD=$(kubectl get pods -l version=v2 -n istioinaction -o  jsonpath={.items..metadata.name}|cut -d ' ' -f1)

kubectl -n istioinaction exec -c catalog $CATALOG_POD  \
  -- curl -s -X POST -H "Content-Type: application/json" \
  -d '{"active": true, "type": "latency", "volatile": true}' \
  localhost:3000/blowup

# 对 catalog-v1-v2 虚拟服务进行配置,使其在请求处理时间超过半秒时超时
kubectl patch vs catalog-v1-v2 -n istioinaction --type json \
      -p '[{"op": "add", "path": "/spec/http/0/timeout", "value": "0.5s"}]'
两种变化:请求半秒后超时,工作负载间歇性变慢。
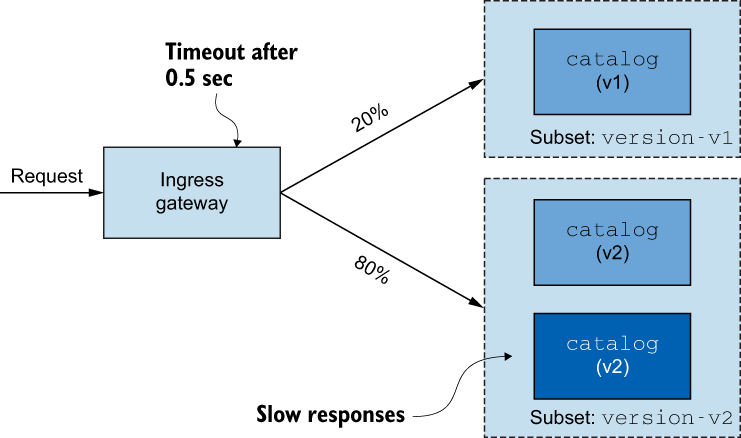
为 catalog 工作负载生成持续流量。生成我们分析所需要的日志和遥测数据
for i in {1..9999}; do curl http://192.168.8.212/items \
-H "Host: catalog.istioinaction.io" \
-w "\nStatus Code %{http_code}\n"; sleep 1s;  done

# 此操作会间断性的出现 错误
upstream request timeout
Status Code 504
查看 Envoy 访问日志#
 kubectl -n istio-system logs deploy/istio-ingressgateway \
 | grep 504
默认情况下,只有 Istio 的演示安装配置文件会将访问日志打印到标准输出。
# 可以通过如下方法配置
istioctl install --set meshConfig.accessLogFile="/dev/stdout"
注意,这将启用整个网格的访问日志记录。要启用某个特定工作负载的访问日志,可以使用
Telemetry API
更改特使访问日志格式
这种更新会应用到整个网格,从而大大增加每个工作负载代理的
日志记录量。在较大的集群中,我们不鼓励这样做,因为这会给日志记录基础架构造成压力。
istioctl install --set profile=demo \
    --set meshConfig.accessLogEncoding="JSON"

# 再次查看日志,使用 jq 格式化后,可观性变好
kubectl -n istio-system logs deploy/istio-ingressgateway \
| grep 504 | tail -n 1 | jq
{
  "protocol": "HTTP/1.1",
  "method": "GET",
  "connection_termination_details": null,
  "response_flags": "UT", # Envoy 返回标识,值为 UT ,代表 "上游请求超时"
  "x_forwarded_for": "192.168.8.170",
  "upstream_host": "10.42.4.139:3000", # 接收请求的上游主机
  "upstream_service_time": null,
  "bytes_received": 0,
  "downstream_remote_address": "192.168.8.170:21110",
  "response_code": 504,
  "upstream_local_address": "10.42.8.196:45484",
  "upstream_transport_failure_reason": null,
  "upstream_cluster": "outbound|80|version-v2|catalog.istioinaction.svc.cluster.local",
  "duration": 500, #  超过 500 毫秒的持续时间
  "response_code_details": "response_timeout",
  "bytes_sent": 24,
  "downstream_local_address": "10.42.8.196:8080",
  "request_id": "3c93d66c-161f-9f4d-8b0b-783ec5f17423",
  "start_time": "2023-10-01T04:17:20.471Z",
  "route_name": null,
  "path": "/items",
  "requested_server_name": null,
  "authority": "catalog.istioinaction.io",
  "user_agent": "curl/8.1.2"
}
response_flags:
https://www.envoyproxy.io/docs/envoy/latest/configuration/observability/access_log/usage
UT,代表 “上游请求超时”UH-没有健康的上游(群集没有工作负载)NR-未配置路由UC-上游连接终止DC-下行连接终止
upstream_host: 值表示处理请求的工作负载的实际 IP 地址。
DEBUG
SLOW_POD_IP=$(kubectl -n istio-system logs deploy/istio-ingressgateway \
| grep 504 | tail -n 1 | jq -r .upstream_host | cut -d ":" -f1)
SLOW_POD=$(kubectl get pods -n istioinaction \
     --field-selector status.podIP=$SLOW_POD_IP \
     -o jsonpath={.items..metadata.name})

# 查看入口网关的日志记录级别
istioctl proxy-config log \
     deploy/istio-ingressgateway -n istio-system

# 提高 connection 、 http 的日志记录级别。, http和 router 日志记录
istioctl proxy-config log deploy/istio-ingressgateway \
   -n istio-system \
   --level http:debug,router:debug,connection:debug,pool:debug

# 查看现在的日志,分析日志。得到有一个实例,响应超时,导致客户端断开。
kubectl logs -n istio-system deploy/istio-ingressgateway \
> /tmp/ingress-logs.txt

[2023-10-01T04:14:35.091Z] "GET /items HTTP/1.1" 504 UT response_timeout - "-" 0 24 500 - "192.168.8.170" "curl/8.1.2" "412ca5dc-e88a-9ffb-97cb-52c1298432c5" "catalog.istioinaction.io" "10.42.4.139:3000" outbound|80|version-v2|catalog.istioinaction.svc.cluster.local 10.42.8.196:44492 10.42.8.196:8080 192.168.8.170:59883 - -
使用 ksniff 检查网络流量
Ksniff–
kubectl插件,使用 tcpdump 捕获 Pod 的网络流量,并将其重定向至 Wireshark和 Wireshark 配合使用,可提供流畅的调试体验
# 安装 krew
https://krew.sigs.k8s.io/docs/user-guide/setup/install/#bash


# 要安装 ksniff
kubectl krew install sniff

# 安装 wireshark
www.wireshark.org/download.html

# wireshark -v
Wireshark 4.0.8 (v4.0.8-0-g81696bb74857).

# 检查 LOCALHOST 接口上的网络流量
kubectl sniff -n istioinaction $SLOW_POD -i lo

# 模拟请求
for i in {1..100}; do curl http://192.168.8.212/items \
-H "Host: catalog.istioinaction.io" \
-w "\nStatus Code %{http_code}\n"; sleep .5s;  done
Wireshark 中执行查询 http contains "GET /items"
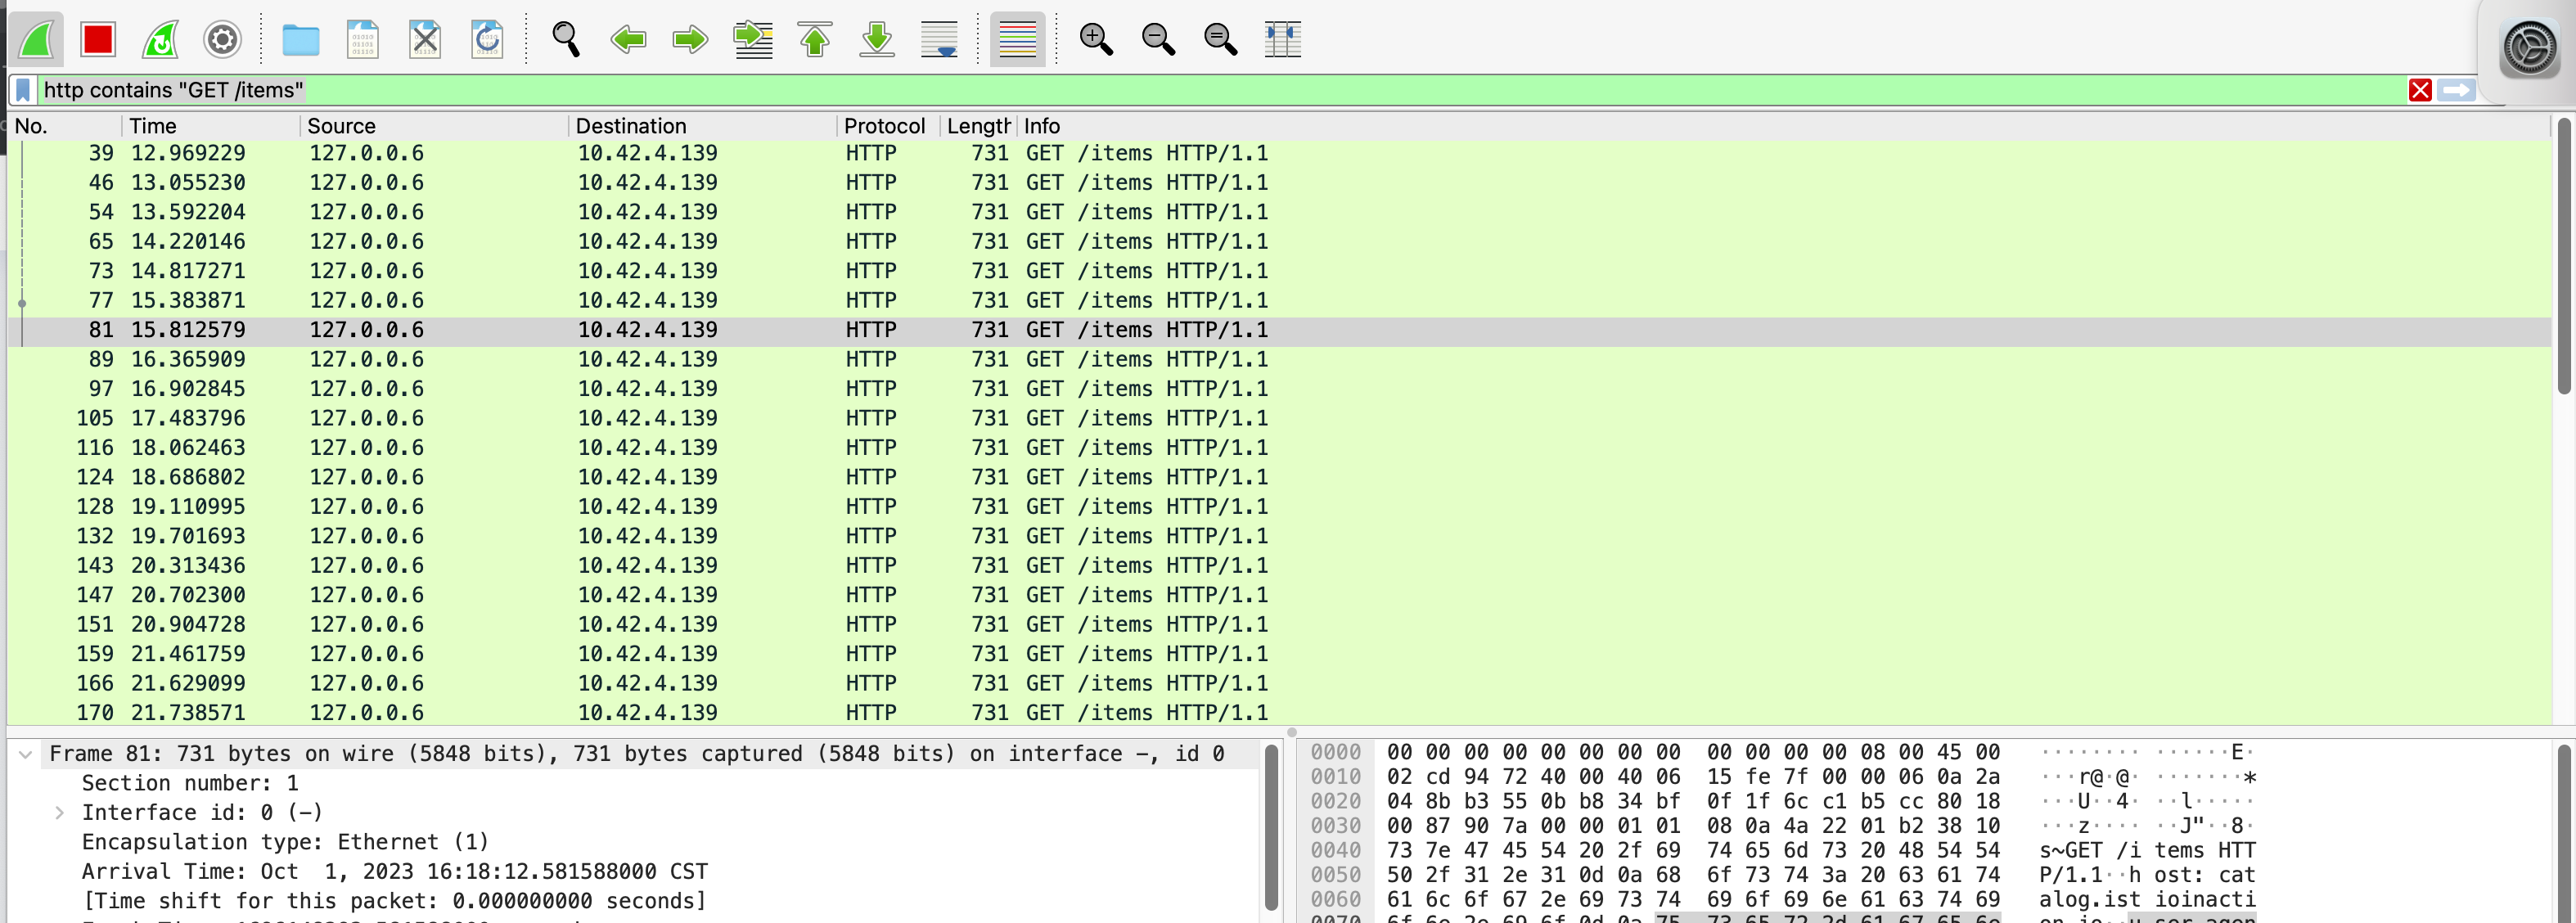
Wireshak 中抓取 TCP 流包,tcp.stream eq 4
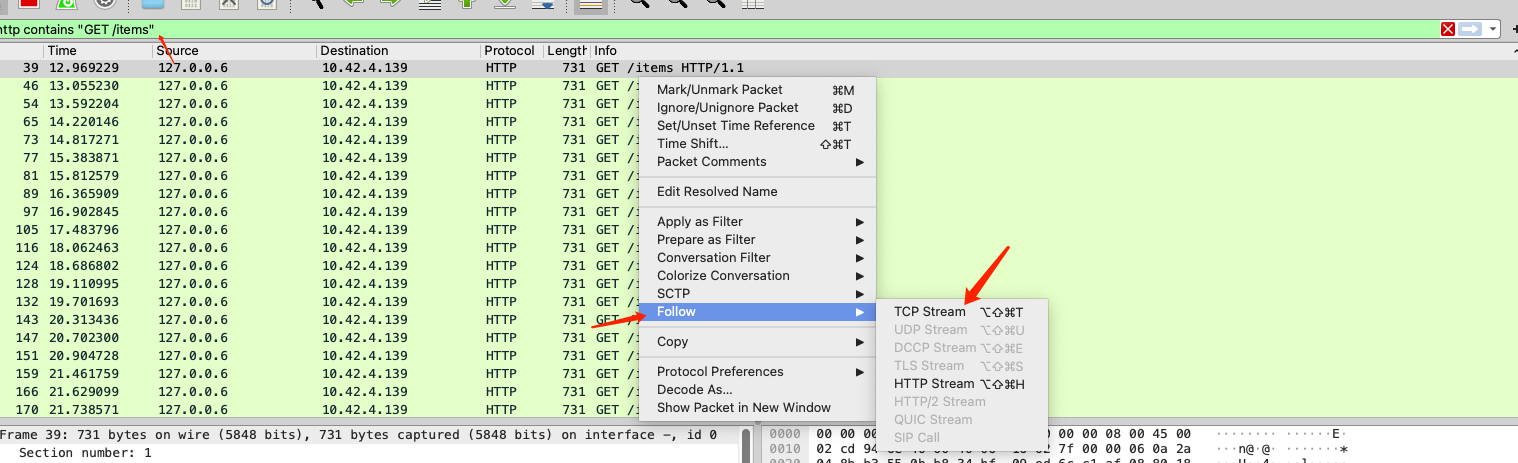
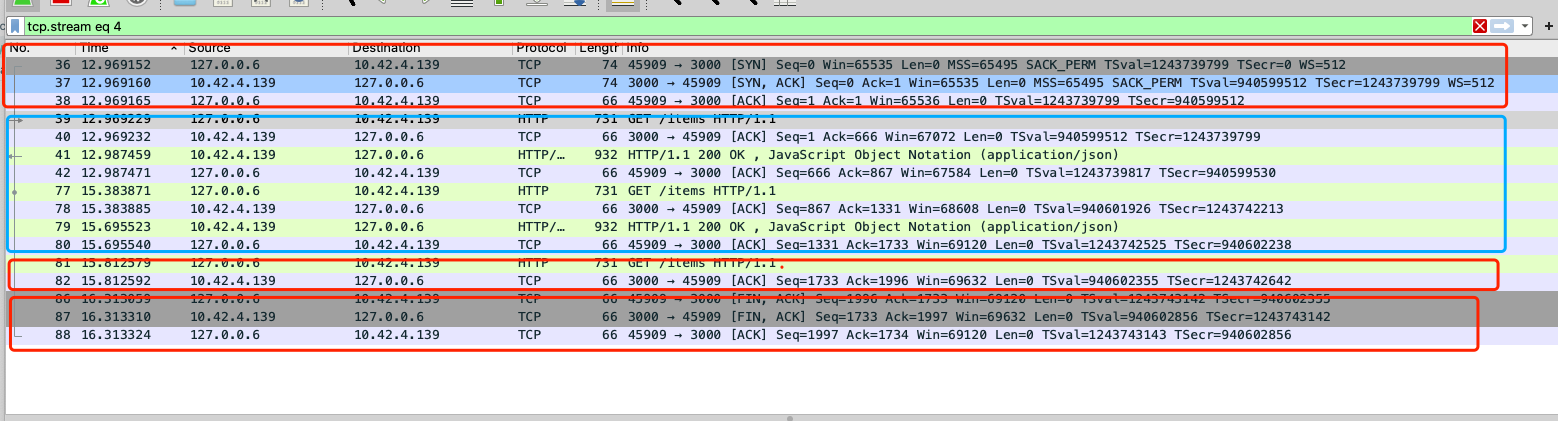
图二数据包,方框依次说明:
- TCP 三次握手以建立 TCP 连接
- 连接建立后,连接被重复用于客户端的多个请求,并且所有请求都成功送达。
- 客户端发出另一个请求,服务器确认了该请求,但响应时间超过半秒。从数据包
82到数据包86的时间差可以看出这一点。15.81259716.313059。
TCP 控制标志
- 同步 (
SYN) 用于建立新连接。 - 确认(
ACK)用于确认数据包已成功接收。 - Finish (
FIN) 用于请求终止连接。
使用 Envoy telemetry 了解应用程序#
for i in {1..100}; do curl http://192.168.8.212/items \
-H "Host: catalog.istioinaction.io" \
-w "\nStatus Code %{http_code}\n"; sleep .5s;  done

# 代理 Grafana
kubectl -n prometheus port-forward svc/prom-grafana 3000:80
登陆Grafana 找到
Istio Service Dashboard正常来说,这里会看到数据,如果没有,检查 Dashboard 版本是否与当前 Istio 版本匹配。
https://grafana.com/grafana/dashboards/7636-istio-service-dashboard/?tab=revisions
服务器报告的成功率是 100%,因为 Envoy 代理会将下游终止请求的响应代码标记为
0,这不是5xx响应,因此不计入失败率。与此同时,客户端将请求标记为正确的状态代码 504(“网关超时”),因此它被计入失败请求中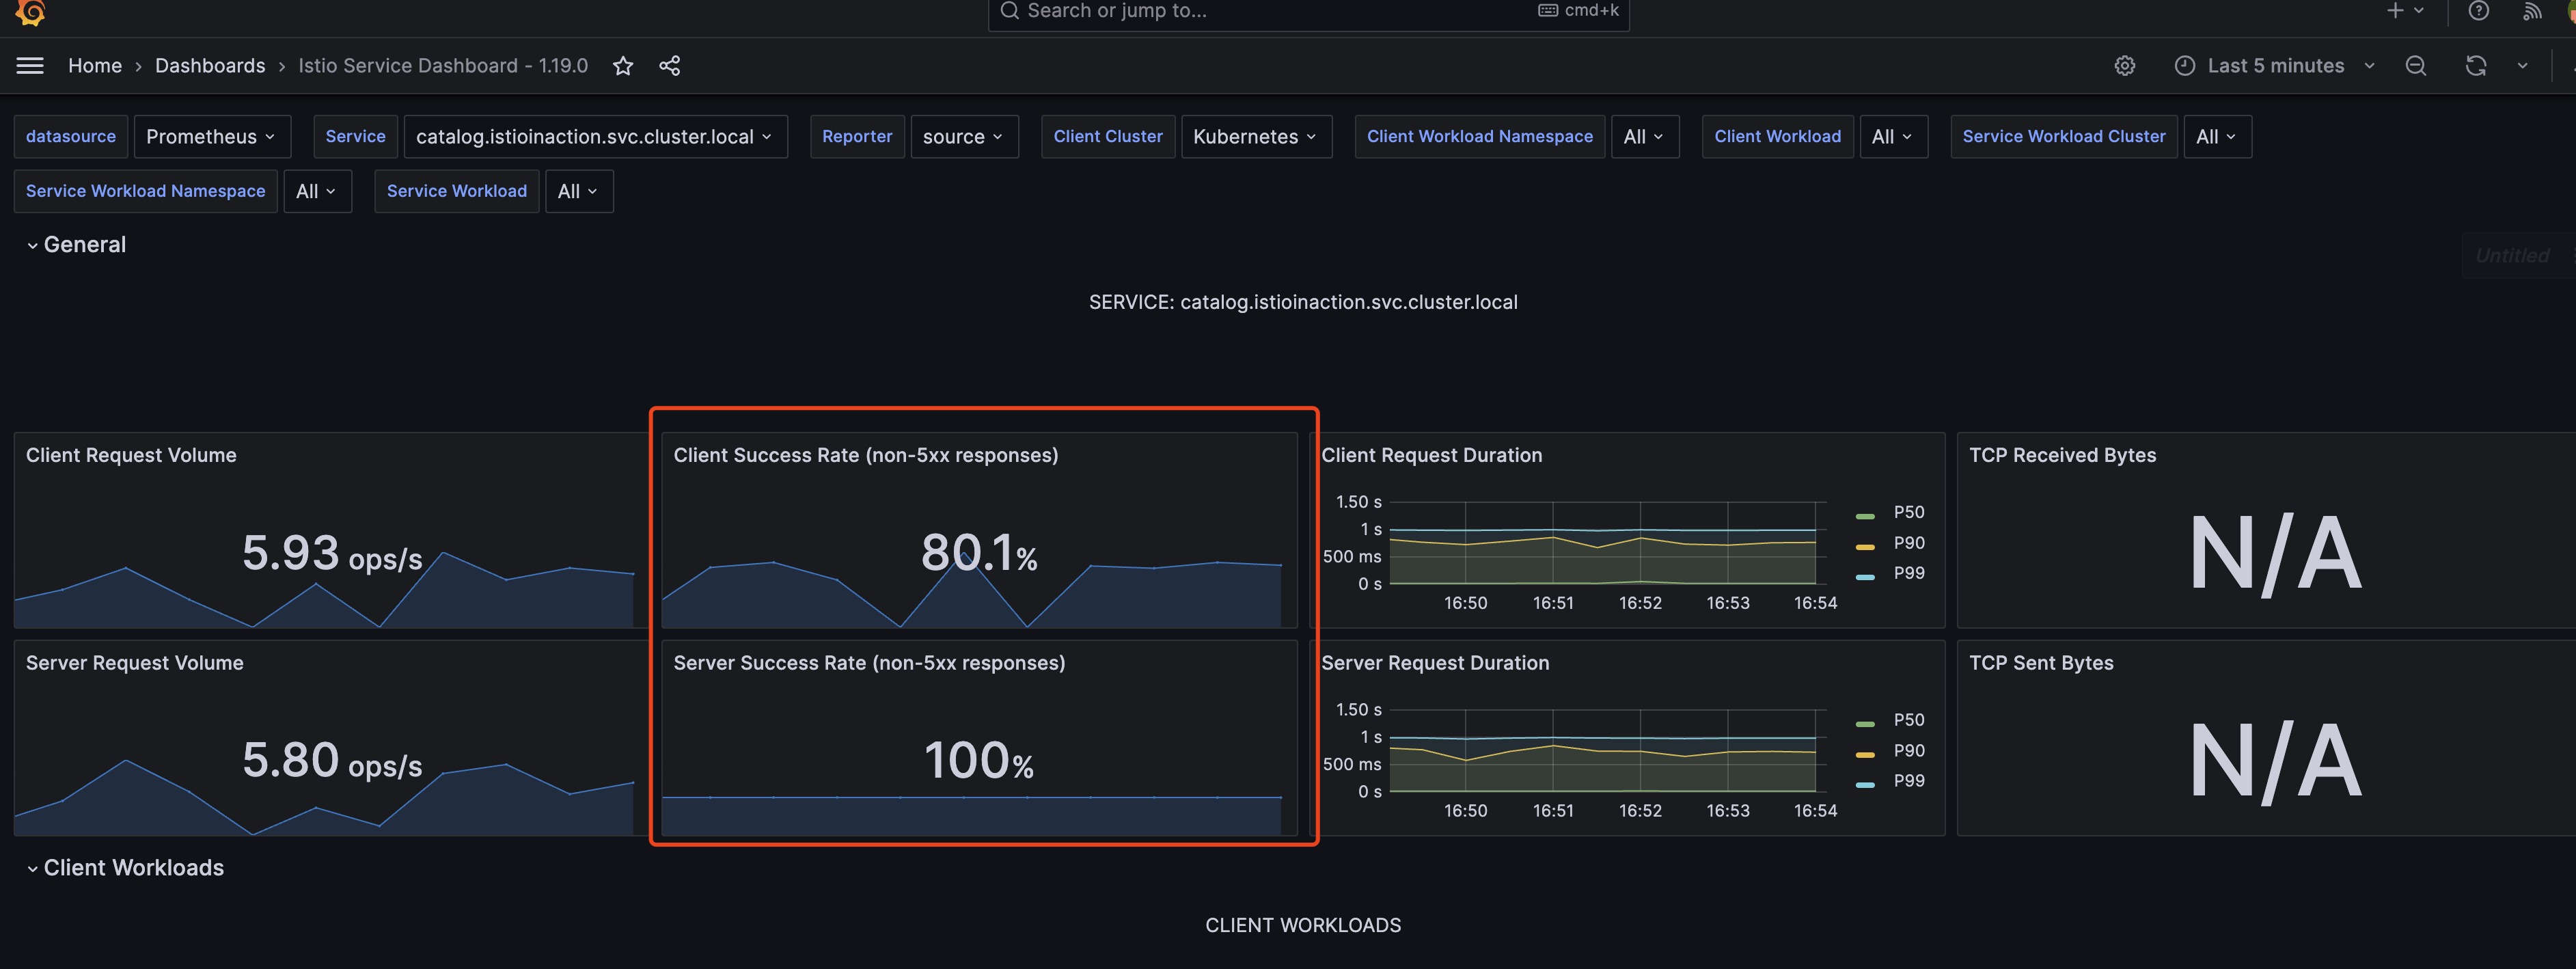
使用 Prometheus 查询受影响的 Pods
kubectl -n prometheus port-forward \
svc/prom-kube-prometheus-stack-prometheus 9090

# 使用 PromQL 查询
sort_desc(sum(irate(
    istio_requests_total{
      reporter="destination",
      destination_service=~"catalog.istioinaction.svc.cluster.local",
      response_flags="DC"}[5m]))
by (response_code, pod_name))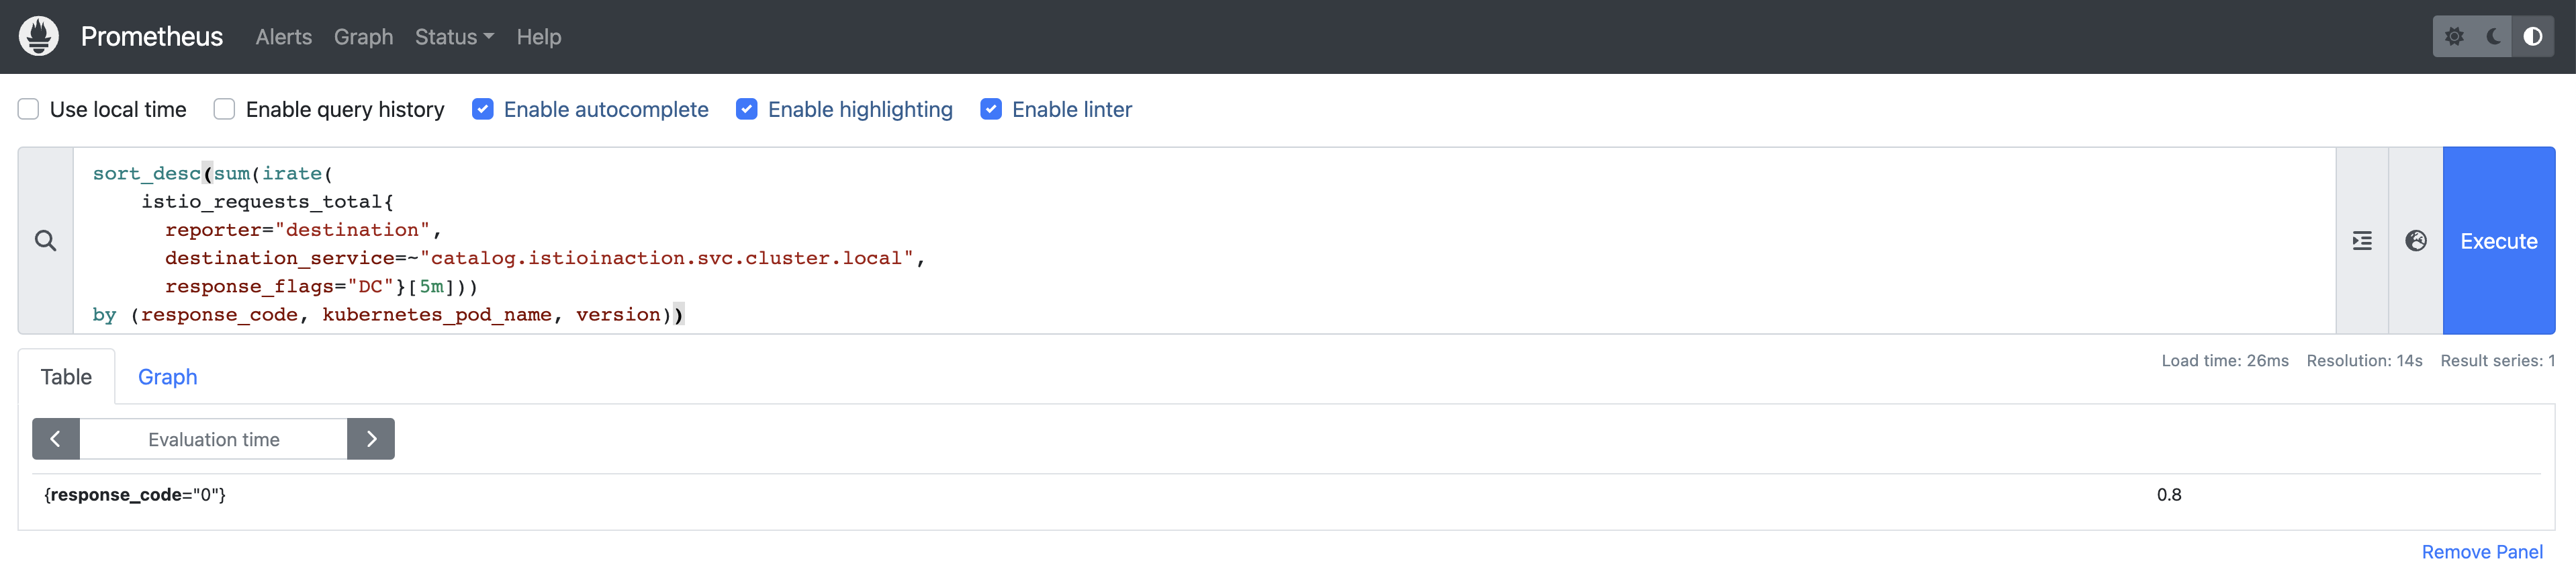
切换为图表
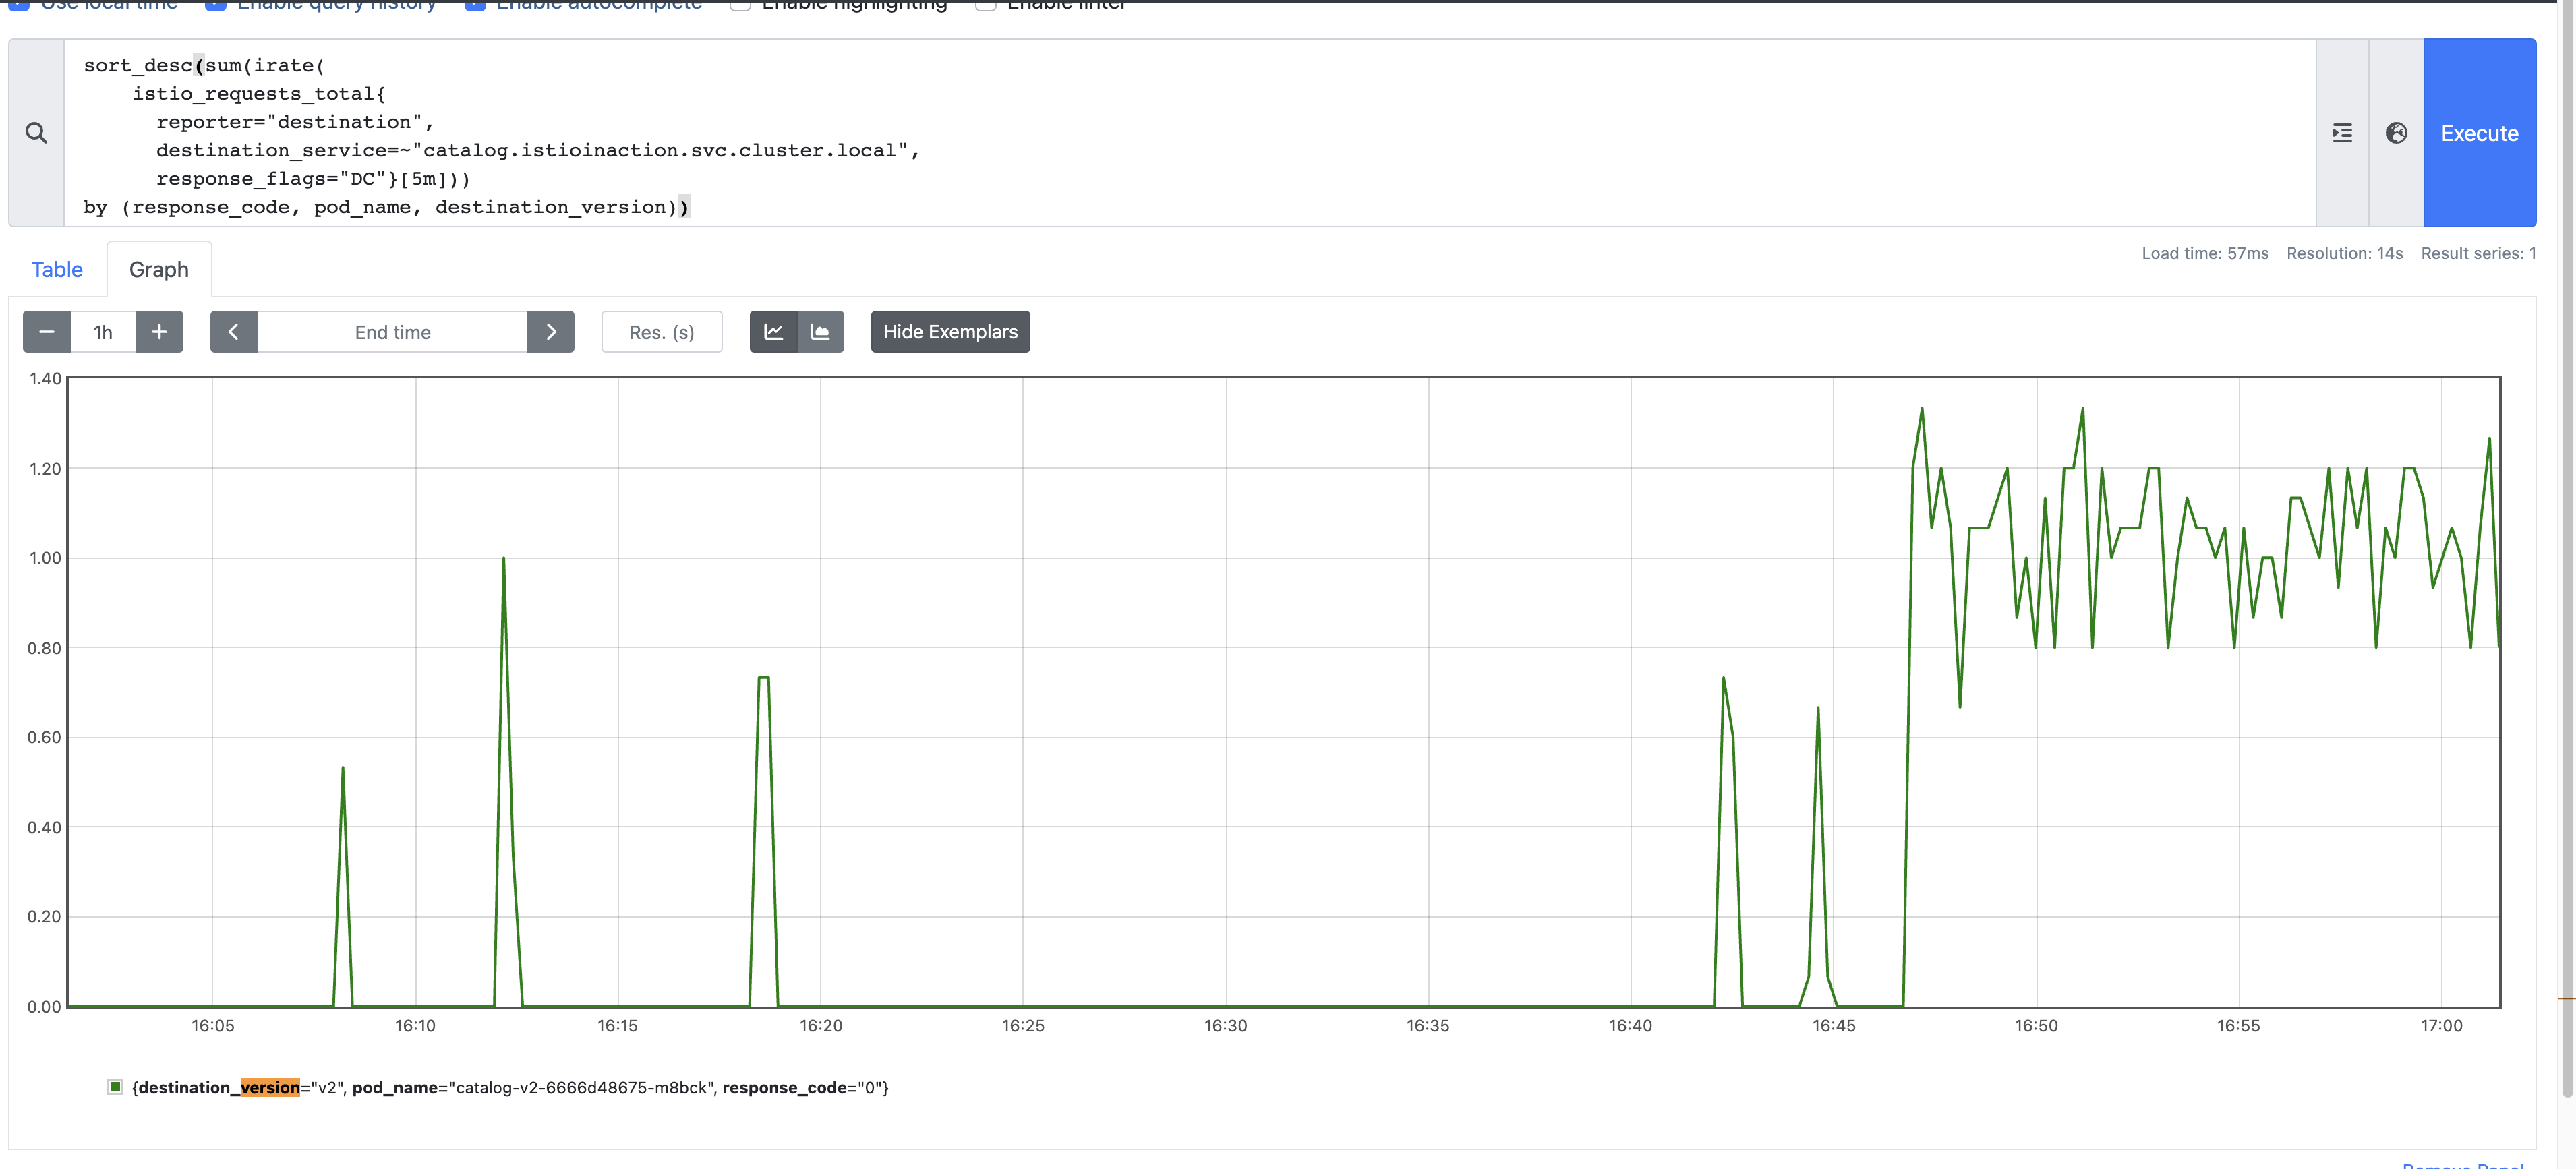
由此我们就找到了存在故障到POD,可以使用一个错误的 app 标签,将此 pod 进行移出端点。
kubectl patch pod catalog-v2-6666d48675-m8bck \
  -p '{"metadata":{"labels":{"app":"catalog-discard"}}}' \
  -n istioinaction
pod/catalog-v2-6666d48675-m8bck patched
执行后将恢复正常
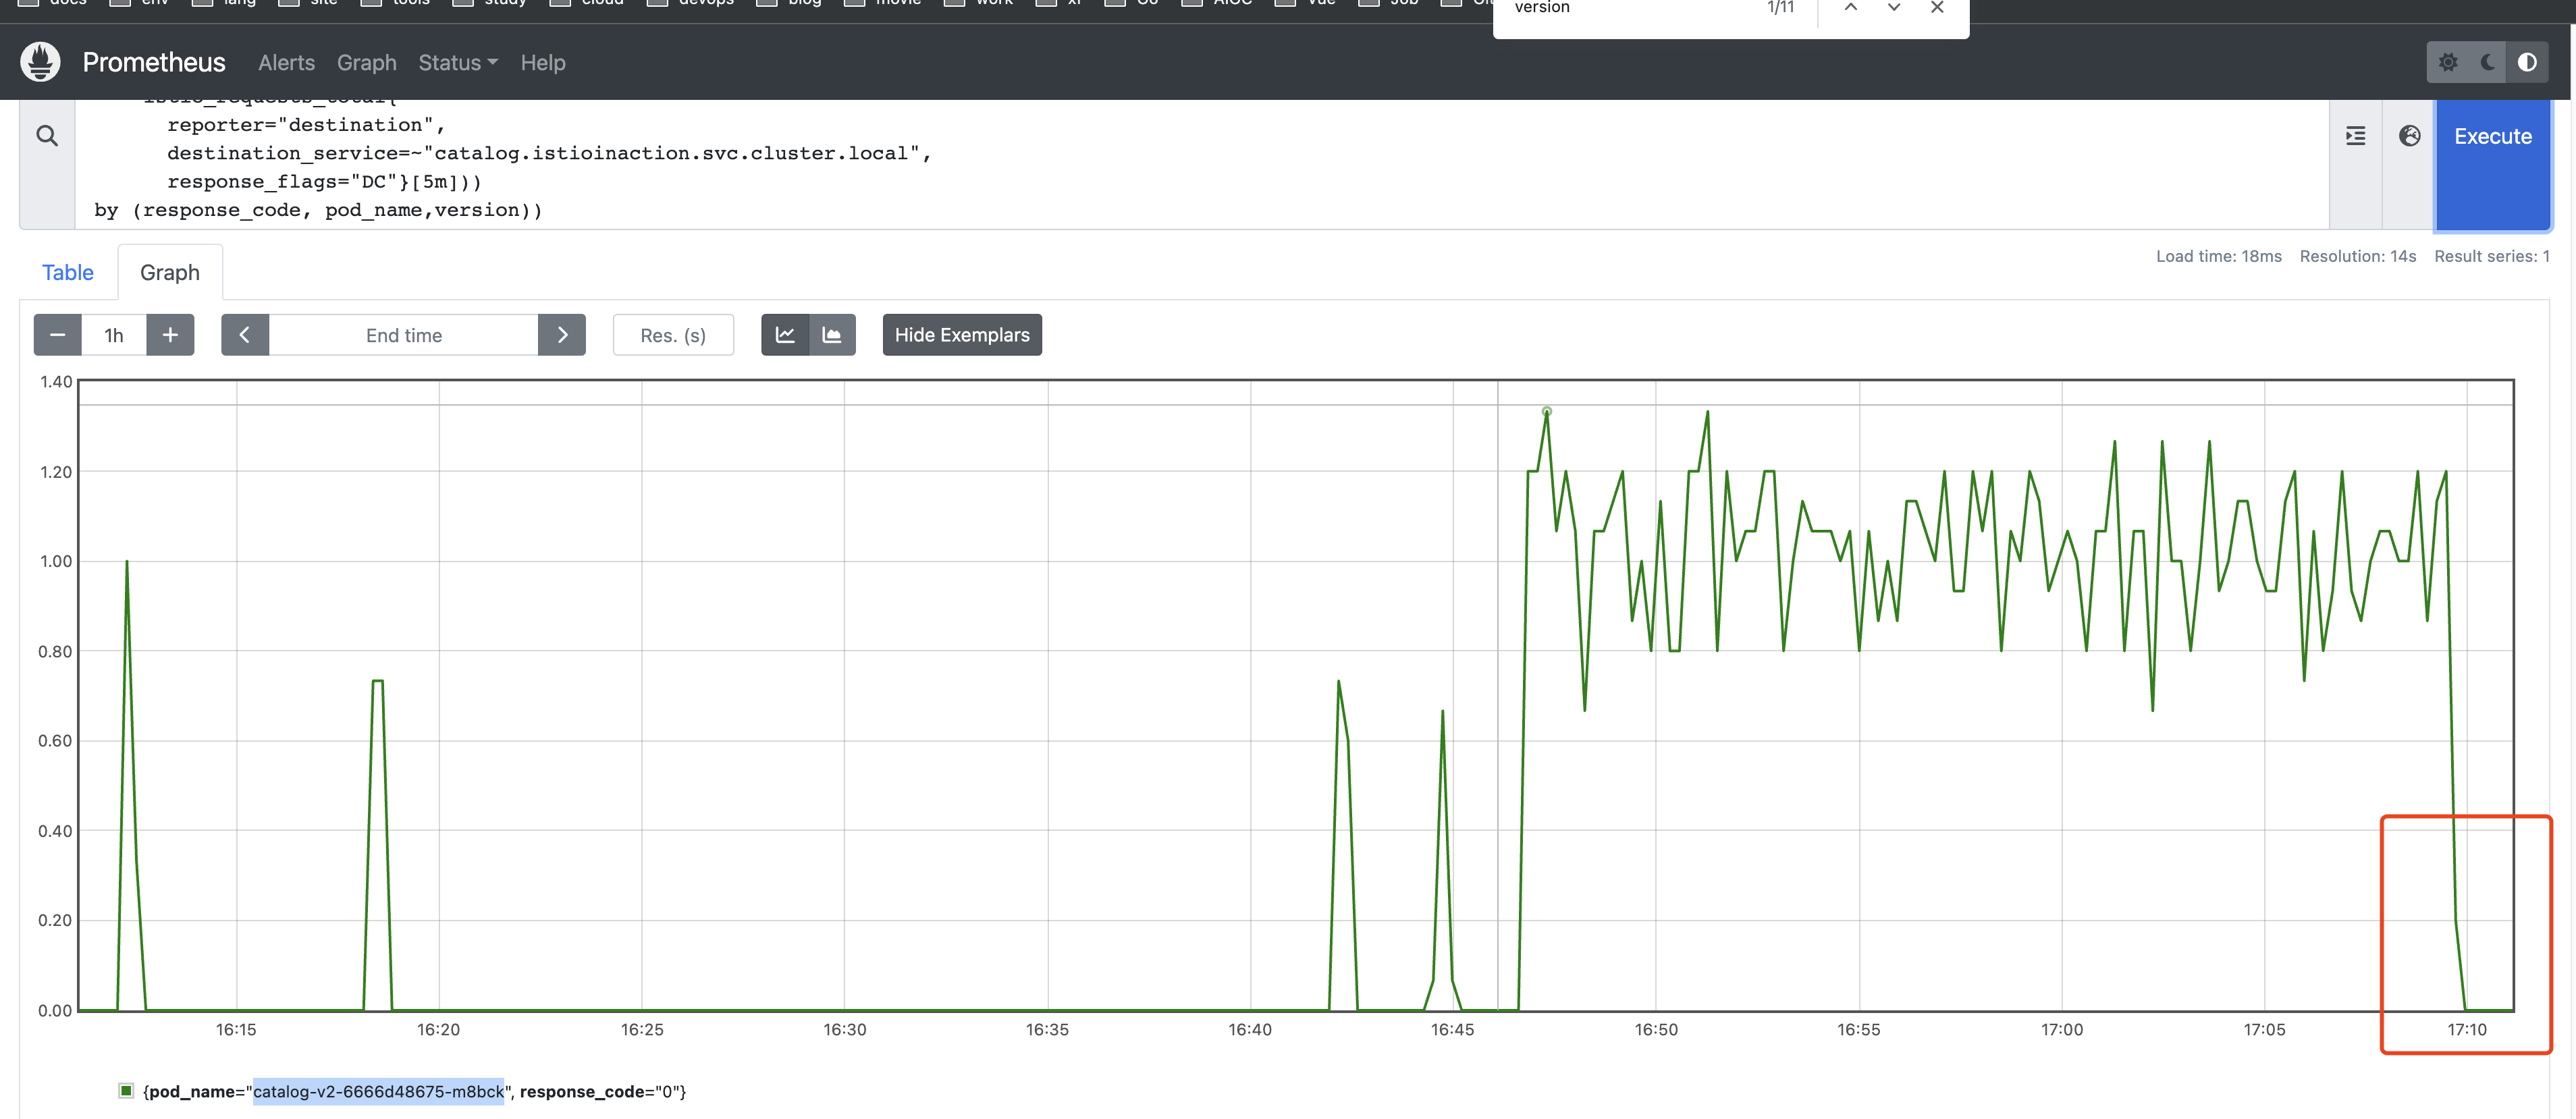
控制平面的性能调整#
幽灵工作负载#
性能下降时出现的一个常见现象被称为幽灵工作负载:服务被配置为将流量路由到早已不存在的端点,从而导致请求失败。
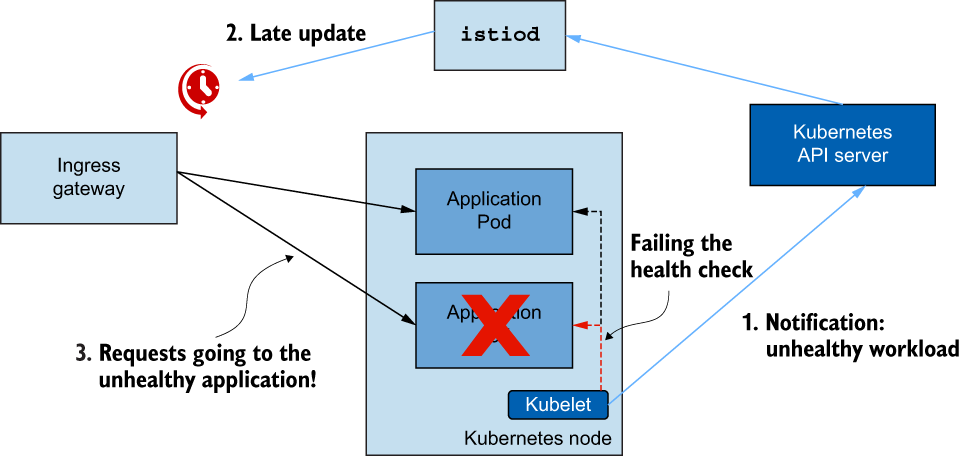
决定性能的因素
- 变化率 - 较高的变化率需要更多的处理来保持数据平面的同步。
- 分配资源–如果需求超过了分配给
istiod的资源,工作就必须排队。,工作就必须排队,从而导致更新分配速度减慢。 - 需要更新的工作负载数量–需要更强的处理能力和网络带宽,才能将更新分配给更多的工作负载。
- 配置大小-分发较大的 Envoy 配置需要更强的处理能力和更大的网络带宽。
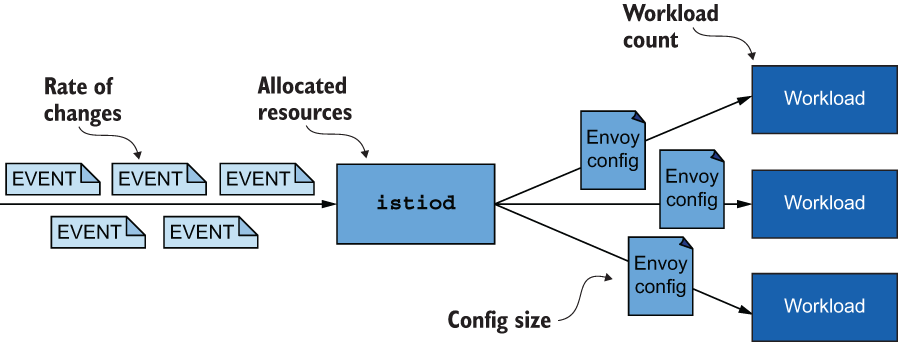
监控控制平面#
istiod 公开了衡量关键性能指标持续时间和频率的指标,如资源利用率、传入或传出流量导致的负载、错误率等。这些指标有助于了解控制平面的运行情况、即将发生的故障,以及如何排除可能已经出现错误的故障。
https://istio.io/latest/docs/reference/commands/pilot-discovery/#metrics
对于 Istio 的控制平面,衡量延迟的标准是控制平面向数据平面分发更新的速度。衡量延迟的关键指标是
pilot_proxy_convergence_time测量整个流程从代理推送请求进入队列到分发到工作负载的持续时间。pilot_proxy_queue_time衡量的是推送请求在队列中等待工作者处理的时间。如果在推送队列中花费了大量时间,我们可以纵向扩展istiod,提高并发处理能力。pilot_xds_push_time衡量向工作负载推送 Envoy 配置所需的时间。时间增加表明网络带宽因数据传输量而超载。在后面的章节中,我们将介绍如何通过减少配置更新的大小和每个代理的变更频率来大大改善这种情况。
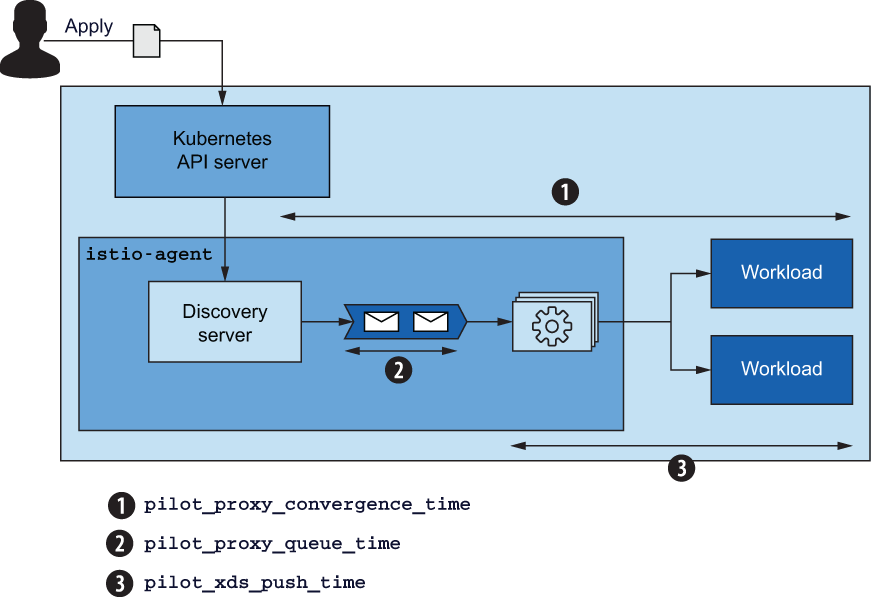
在之前配置 Istio 的 Control Plane Dashboard 中可以看到
99.9% 的推送分配到工作负载的时间少于 100 毫秒,这是理想状态
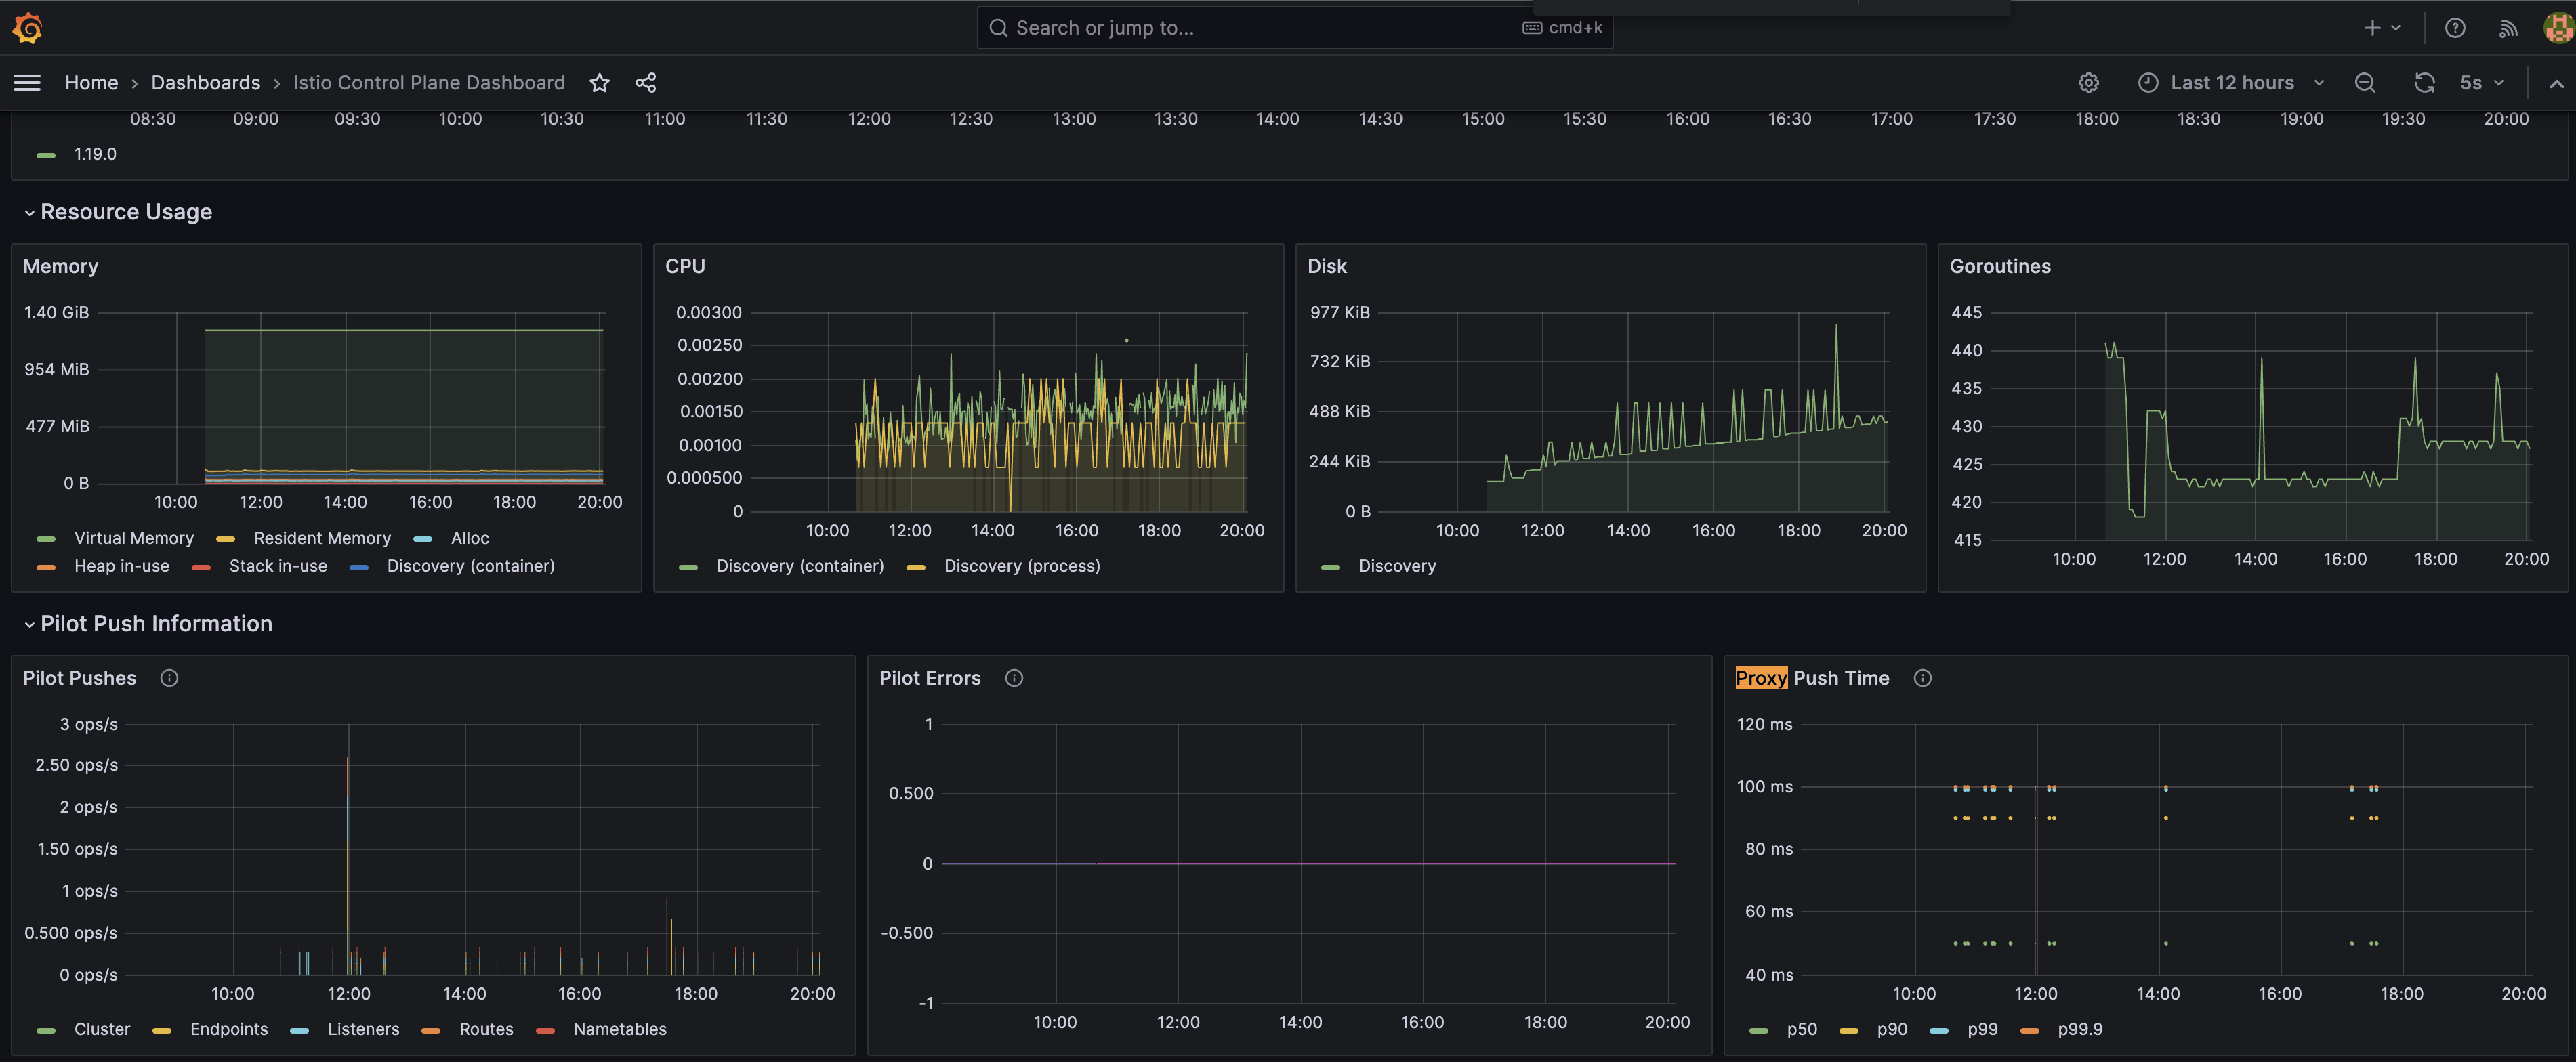
建议使用这些基线来考虑阈值
- 延迟时间超过 1 秒且超过 10 秒时,发出严重警告
- 当延迟时间超过 2 秒且超过 10 秒时,严重程度为临界状态
当收到第一个警报时,不必惊慌;这只是一个行动呼吁,说明服务延迟已经增加,性能需要优化。但是,如果不加以控制,进一步的性能下降将影响最终用户。
饱和度#
CPU
饱和度指标显示资源的使用能力。如果利用率超过 90%,说明服务已经饱和或即将饱和。当
istiod达到饱和时,由于推送请求排队等待处理的时间较长,分发更新的速度会减慢。饱和通常是由最受限制的资源造成的,由于
istiod是CPU 密集型资源,通常是CPU 首先饱和。衡量 CPU 利用率的指标有
container_cpu_usage_seconds_total测量 Kubernetes 容器报告的 CPU 利用率。process_cpu_seconds_total根据istiod仪器报告的 CPU 利用率进行测量。
流量
流量指标衡量系统所承受的负载。例如,对于网络应用程序来说,负载是以每秒请求数来定义的。同时,Istio 的控制平面会接收传入流量(以配置更改的形式),并产生传出流量(将更改推送到数据平面)。我们需要测量这两个方向的流量,以找到性能限制因素;在此基础上,我们可以采用不同的方法来提高性能。
输入流量的指标如下:
pilot_inbound_updates显示每个istiod实例收到的配置更新计数。pilot_push_triggers是触发推送的事件总数。推送触发器可以是以下类型之一:service,endpoint或config。其中config表示任何 Istio 自定义资源,如Gateway或VirtualService。.pilot_services衡量试点已知的服务数量。当试点已知的服务越多,就需要对传入事件进行更多处理,以生成 Envoy 配置。因此,该指标对istiod因传入流量而承受的负载起着重要作用。出站流量指标如下:
pilot_xds_pushes测量控制平面发出的所有类型的推送,如listener、route和cluster。,route,cluster和endpoint更新。该指标在Istio Control Plane Dashboard中展示。
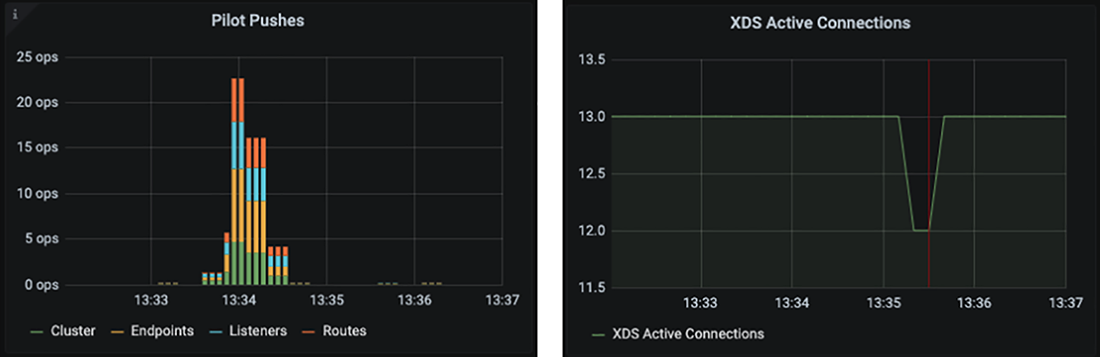
Pilot Pushes 图表显示推送频率。XDS 活动连接图显示由控制平面管理的端点
pilot_xds显示每个试点实例处理的工作负载总连接数。该指标在Istio Control Plane Dashboard显示,标题为ADS Monitoring。envoy_cluster_upstream_cx_tx_bytes_total测量通过网络传输的配置大小。
故障#
错误代表
istiod的故障率,通常在服务饱和、性能下降时出现。
| Metric | Description |
|---|---|
| pilot_total_xds_rejects | pushes 被拒绝的配置推送次数 |
| pilot_xds_eds_reject,pilot_xds_lds_reject,pilot_xds_rds_reject,pilot_xds_cds_reject | pilot_total_xds_rejects 指标的子集,用于缩小 API 推送被拒绝的范围 |
| pilot_xds_write_timeout | The sum of errors and timeouts when initiating a push 启动推送时的错误和超时总和 |
| pilot_xds_push_context_errors | Istio Pilot 在生成 Envoy 配置时的错误计数;通常是 Istio Pilot 中的错误 |
调整性能#
提高控制平面性能的选项#
如下:
- 忽略与服务网格无关的事件。
- 在较长时间内批处理事件,以减少更新数据平面所需的推送次数。
- 通过以下方式分配额外资源
- 扩大
istiod部署规模,通过在试点实例之间分配所管理的工作负载数量来减少负载 - 扩大
istiod部署规模,以加快 Envoy 配置的生成速度,同时处理更多推送请求
- 扩大
- 更新针对工作负载的相关配置去通知控制平面,只向匹配工作负载推送相关更新。
- 只发送服务代理进程所需的最小配置,从而减少发送到服务代理的配置大小
- 减少为单个事件更新的代理数量
kubectl config set-context $(kubectl config current-context) \
 --namespace=istioinaction

kubectl delete virtualservice,deployment,service,\
destinationrule,gateway --all

kubectl -n istioinaction apply -f services/catalog/kubernetes/catalog.yaml
kubectl -n istioinaction apply -f ch11/catalog-virtualservice.yaml
kubectl -n istioinaction apply -f ch11/catalog-gateway.yaml
kubectl -n istioinaction apply -f ch11/sleep-dummy-workloads.yaml

#  在 Envoy 配置中添加一些虚假服务,使情况进一步恶化,创建 600个
kubectl -n istioinaction apply -f ./ch11/resources-600.yaml

# 现在单个 istiod 实例管理着 13 个工作负载(包括入口和出口网关),已知的服务总数还有 600 个,这增加了生成 Envoy 配置的处理量,并使推送给工作负载的配置变得更加臃肿。
测量优化前的性能
了解 P99
P99 或第 99 百分位数测量的是
传播最快的 99% 更新的最大延迟。例如,80 毫秒的 P99 延迟告诉我们,99% 的请求传播速度超过 80 毫秒!我们并不确切知道这些请求中的每一个请求的延迟时间,大多数请求的延迟时间可能只有几毫秒。但我们知道,如果只考虑最快的 99%,即使是表现最差的请求也能在 80 毫秒内得到服务。
# 让我们重复运行 10 次测试,每次重复之间延迟 2.5 秒,以分散更改,避免成批更改:
./bin/performance-test.sh --reps 10 \
  --delay 2.5 --gateway 192.168.8.212
...
==============
Push count: 700 # Push 应用更改的次数
Latency in the last minute: 0.49 seconds # 最后一分钟的延迟

# 根据测试结果,使用当前配置分发更改时,共执行了 700 次推送,P99 延迟为 0.49 毫秒。
使用SIDECARS 减少配置大小和推送次数
# 计算一下 catalog 工作负载的配置大小
CATALOG_POD=$(kubectl -n istioinaction get pod -l app=catalog \
    -o jsonpath={.items..metadata.name}  | cut -d ' ' -f 1)

kubectl -n istioinaction exec -ti $CATALOG_POD -c catalog \
    -- curl -s localhost:15000/config_dump > /tmp/config_dump

du -sh /tmp/config_dump
2.3M    /tmp/config_dump

# 配置大小为 2.3M 。这已经很大了!即使是 200 个工作负载的中型集群,Envoy 配置的大小也达到了 920 MB,这就需要更多的计算能力、网络带宽和内存,因为这些配置都存储在每个旁路代理中。

apiVersion: networking.istio.io/v1beta1
kind: Sidecar
metadata:
  name: default
  namespace: istioinaction
spec:
  workloadSelector:  # 字段限制了 Sidecar 配置适用的工作负载。
    labels:
      app: foo
  egress: # egress 字段指定了应用程序通过 Sidecar 向外部服务发送出站流量的处理方式。如果省略,配置将从更通用的 Sidecar(如果存在)继承出口配置;否则,配置将返回到访问所有其他服务的默认行为。
  - hosts:
    - "./bar.istioinaction.svc.cluster.local"
    - "istio-system/*"
Sidecar 其他字段含义
- outboundTrafficPolicy: 指定处理出站流量的模式。可以设置为以下任一模式
REGISTRY_ONLY模式,可将工作负载配置为只允许向其配置的服务发送出站流量ALLOW_ANY模式,允许向任何目的地发送出站流量当
Sidecar资源应用于工作负载时,控制平面会使用egress字段来确定工作负载需要访问哪些服务。这样,Istio 的控制平面就能识别相关配置和更新,并只向相应代理发送这些配置和更新。避免了生成和分发所有关于如何访问其他服务的配置,从而减少了 CPU、内存和网络带宽消耗。
全网格 Sidecar 配置定义#
要减少发送到每个服务代理的 Envoy 配置并提高控制平面性能,最简单的方法就是定义一个全网状网络的 Sidecar 配置,只允许出口流量到
istio-system名称空间中的服务。定义这样的默认配置后,网状网络中的所有代理都将获得仅连接控制平面的最低配置,并放弃连接其他服务的所有配置。这种方法引导服务所有者走上正确的道路,为其工作负载定义更具体的 Sidecar 定义,并明确说明其服务所需的所有出口流量,从而确保工作负载获得其流程所需的最低相关配置。
apiVersion: networking.istio.io/v1beta1
kind: Sidecar
metadata:
  name: default                ❶  istio-system 命名空间中的 Sidecar 将适用于整个网格。
  namespace: istio-system      ❶
spec:
  egress:
  - hosts:
    - "istio-system/*"         ❷ 出口流量仅为 istio 系统命名空间中的工作负载配置。
    - "prometheus/*"
  outboundTrafficPolicy:
    mode: REGISTRY_ONLY        ❸ REGISTRY_ONLY 模式只允许向 Sidecar 配置的服务发送出站流量。

# 应用到集群
kubectl apply -f ch11/sidecar-mesh-wide.yaml

# 再次验证一下
kubectl -n istioinaction exec -ti $CATALOG_POD -c catalog \
    -- curl -s localhost:15000/config_dump > /tmp/config_dump

du -sh /tmp/config_dump
644K    /tmp/config_dump # 配置大小从 2.3 MB 大幅减少到 644K。

# 现在再次测试一下 P99
./bin/performance-test.sh --reps 10 \
  --delay 2.5 --gateway 192.168.8.212

Push count: 74
Latency in the last minute: 0.10 seconds
推送次数和延迟都有所下降。性能的提升说明了定义全网格 Sidecar 资源的重要性。
Sidecar 配置范围#
与
PeerAuthentication资源类似,可应用于不同范围
- 全网格 Sidecar适用于网格中的所有工作负载,并可定义默认值,例如限制出口流量,除非另有明确规定。要创建全网格配置,可在 Istio 安装命名空间(如
istio-system)中应用。按照惯例,整个网状网络的 Sidecar 命名为default。- 命名空间范围的 Sidecar 配置优先级更高,可覆盖全网格范围的配置。要创建命名空间的 Sidecar 配置,请在所需的命名空间中应用该配置,而无需定义
workloadSelector字段。按照惯例,命名空间范围内的 Sidecar 也被命名为default- 特定于工作负载的 Sidecar 配置针对的是与
workloadSelector属性匹配的特定工作负载。该配置最为具体,可覆盖整个网格和整个命名空间的配置。
忽略事件#
Istio 控制平面默认监视所有命名空间中 Pod、服务和其他资源的创建事件,在大型集群中,这可能会给控制平面造成压力,因为控制平面需要处理并生成每个事件的 Envoy 配置,以保持数据平面的更新。
为了减轻这种压力,Istio 1.10 添加了名为命名空间发现选择器的新功能,允许您精确调整控制平面所关注的入站事件。通过该功能,您可以准确指定要关注的工作负载和端点命名空间。
# 启用发现选择器功能
apiVersion: install.istio.io/v1alpha1
kind: IstioOperator
metadata:
  namespace: istio-system
spec:
  meshConfig:
    discoverySelectors:              ❶ 启用发现选择器
      - matchLabels:
          istio-discovery: enabled   ❷ 指定要使用的标签

# 将控制平面处理的命名空间子集限制为只有标有 istio-discovery: enabled 的命名空间。.如果某个命名空间没有该标签,则会被忽略。


# 在集群中要包含大部分命名空间,只排除一小部分,可以使用标签匹配表达式来指定不包含哪些命名空间。
apiVersion: install.istio.io/v1alpha1
kind: IstioOperator
metadata:
  namespace: istio-system
spec:
  meshConfig:
    discoverySelectors:
      - matchExpressions:
        - key: istio-exclude
          operator: NotIn
          values:
            - "true"

istioctl install -y -f ch11/istio-discovery-selector.yaml

# 创建一个包含新工作负载的新命名空间。给这个新命名空间贴上如下标签
kubectl label ns new-namespace istio-exclude=true
事件批处理和推送节流特性#
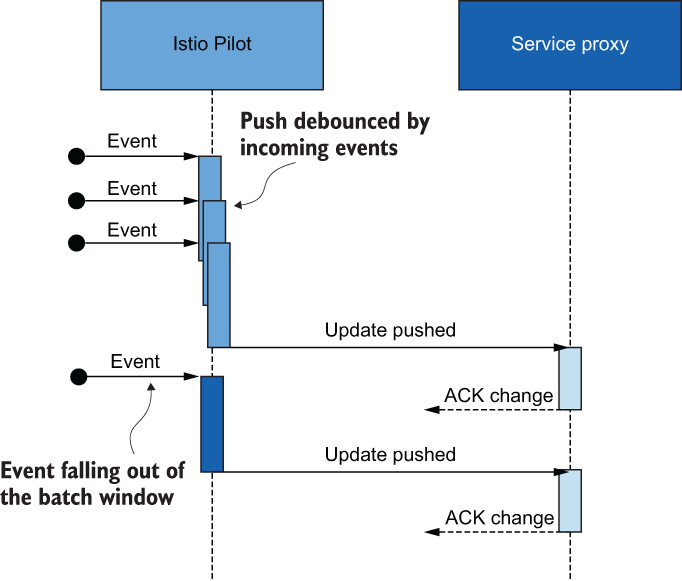
反向缩短周期可确保更快的更新。但是,这样做会产生许多控制平面可能无法分发的推送请求;这些请求将在推送队列中被节流,从而导致延迟增加。
环境变量来定义批处理周期和推送节流
PILOT_DEBOUNCE_AFTER-指定将事件添加到推送队列的消隐时间。默认设置为 100 ms,这意味着当控制平面接收到一个事件时,会在 100 ms 内取消将其添加到推送队列的操作。在这段时间内发生的其他事件将与前一个事件合并,并再次取消该操作。如果在这段时间内没有事件发生,所产生的批次就会被添加到推送队列中,随时可以进行处理。PILOT_DEBOUNCE_MAX-指定允许事件排阻的最长时间。超过该时间后,当前合并的事件将被添加到推送队列中。默认情况下,此变量设置为 10 秒。PILOT_ENABLE_EDS_DEBOUNCE-指定端点更新是否符合延迟规则,或是否具有优先级并立即进入推送队列。默认情况下,该变量被设置为true。这意味着端点更新也会被去抖。PILOT_PUSH_THROTTLE-指定istiod同时处理的推送请求。默认情况下,此变量设置为 100 个并发推送。如果 CPU 利用率不足,可以将节流阀设置为更大的数值,以加快更新速度。
使用这些配置选项的一些一般指导
当控制平面饱和,传入流量导致性能瓶颈时,增加事件批处理。- 如果目标是更快地传播更新,则应减少事件批处理并增加并发推送。只有在控制平面不饱和的情况下,才建议这样做。
- 当控制平面趋于饱和,出站流量成为性能瓶颈时,减少并发推送。
- 当控制平面未达到饱和,或您已扩大规模并希望加快更新速度时,增加并发推送次数。
# 增加事件批量推送的周期。 2.5 秒是个高得离谱的值,这不应该在生产中使用
istioctl install --set profile=demo \
      --set values.pilot.env.PILOT_DEBOUNCE_AFTER="2500ms"

./bin/performance-test.sh --reps 10 \
  --delay 2.5 --gateway 192.168.8.212

Push count: 28
Latency in the last minute: 0.10 seconds

# 推送次数减少到只有 28 次
减少配置推送给工作负载的工作,会降低 CPU 利用率和网络带宽消耗。
值的大小根据观察到的指标和环境调整 Istio 控制平面的配置,并以较小的增量进行调整,这比做出可能对控制平面性能产生不利影响的重大变更更安全。
调整延迟指标
延迟指标测量的时间是从推送请求添加到推送队列时开始的, (上图)。这就意味着,在事件被转发的同时,更新并没有送达。因此,推送更新的时间增加了,但这并没有出现在延迟指标中。
由于事件排错时间过长而导致延迟增加,就像性能低下一样,会导致配置陈旧。因此,可对批处理属性进行适度修改,稍微增大或减小数值。
注意 数据平面通常会受到端点更新延迟的影响。将环境变量
PILOT_ENABLE_EDS_DEBOUNCE设置为false可确保端点更新不会延迟并跳过除错期。
为控制平面分配额外资源
可以使用 HPA 为 istiod 进行自动伸缩
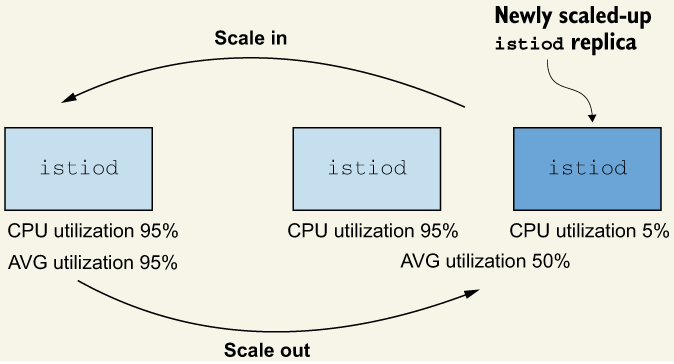
性能调整指南#
在调整性能之前,请记住 Istio 的性能确实很高。Istio 团队用以下参数测试每个新版本
- 1,000 个 Kubernetes 服务使 Envoy 配置变得臃肿
- 2,000 个需要同步的工作负载
- 整个服务网格每秒 70,000 次请求
官方数据: https://istio.io/latest/docs/ops/deployment/performance-and-scalability/
控制平面性能调整指南:
- 确保这是性能问题。回答以下问题
- 数据平面与控制平面之间是否存在连接?
- 是平台问题吗?例如,在 Kubernetes 上,API 服务器是否健康?
Sidecar资源是否定义为范围变更?
- 找出性能瓶颈。使用收集到的延迟、饱和度和流量指标,为调整决策提供信息。例如
- 在控制平面未饱和的情况下,延迟增加表明资源未得到最佳利用。可以提高并发推送阈值,以便并发处理更多的推送。
- 利用率低但在负载情况下很快达到饱和,说明更改非常频繁,也就是说,在长时间没有更改的情况下,会在短时间内出现峰值事件。增加 Istio Pilot 的副本数量,或者,如果有延迟更新的余地,调整批处理属性。
- 进行渐进式改革。找出瓶颈后,进行渐进式更改。例如,为了解决控制平面接收事件序列的时间较长的问题,很容易将去抖周期延长一倍甚至四倍,但这样做很容易导致数据平面变得陈旧。取而代之的是进行细微的调整,如在 10% 到 30% 的范围内增加或减少属性。然后,监测几天的效益(或性能下降),并根据新数据做出明智的决定。
- 确保安全。Istio Pilot 正在管理整个网格的网络;宕机很容易导致网络中断。请务必审慎使用控制平面的资源,切勿将规模扩大到两个副本以下,并在安全范围内行事。
- 考虑使用可突发虚拟机。Istio Pilot 不需要持续的 CPU 资源,而且对性能有突发要求。
# clean
kubectl delete -f ch11/sidecar-mesh-wide.yaml
网格融合#
网格融合,也称为多网格融合,可实现两个独立服务网格的工作负载通信。这种方案的自动化程度较低,需要在两个网格上进行手动配置,以实现服务到服务的流量。
所需的条件
- 跨群集工作负载发现: 控制平面(Istiod) 必须能发现对方集群中的工作负载,以便配置服务代理。
- 跨集群工作负载连接性: 工作负载之间必须具有连接性
- 集群之间的共同信任: 跨集群工作负载必须相互验证,以启用 Istio 的安全功能。
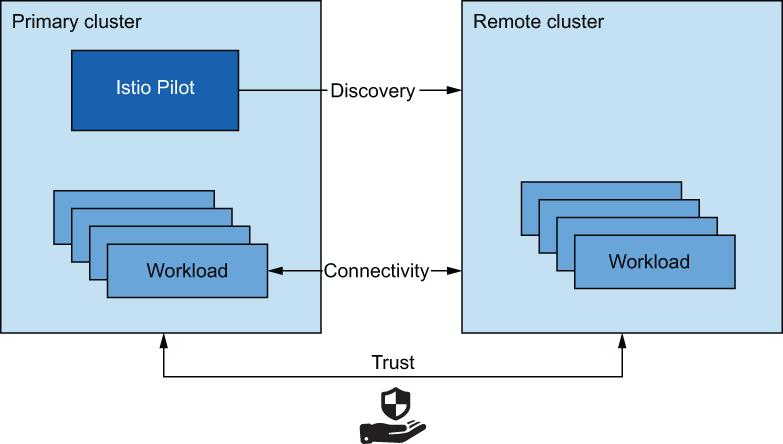
每个 workloads 都可以访问所有其他集群的 API。在这种情况下,Gloo Mesh 是一种很好的解决方法。
多集群式部署#
- Primary cluster : 安装 Istio 控制平面
- Remote cluster: 控制平面安装的远程集群
单个控制平面或共享控制平面部署模式(主从模式)。这种模式使用的资源较少,但主群集的中断会影响整个网状网络。因此,它的可用性较低
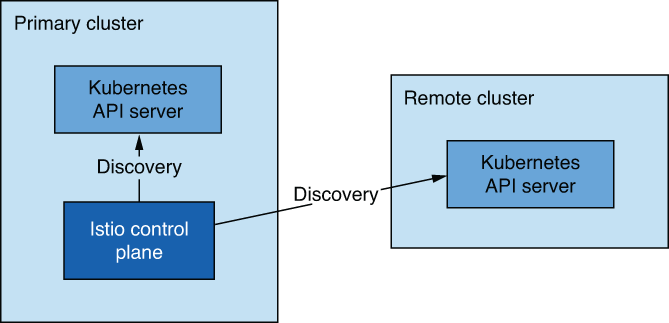
主主部署模式, 有多个控制平面,可确保更高的可用性,但需要更多的资源。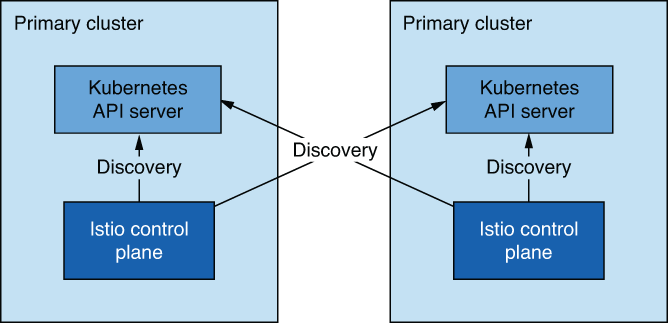
外部控制平面,所有集群都使用远程方式连接到控制平面。
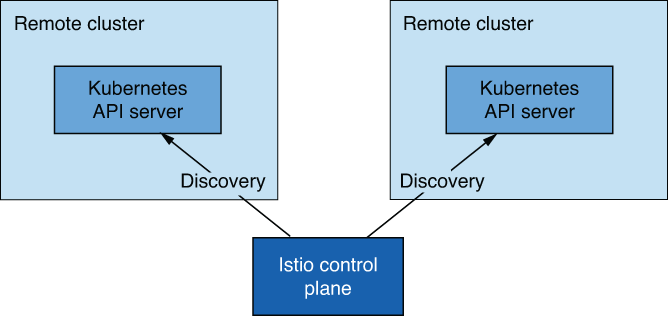
如何在多群集部署中发现工作负载
- Kubernetes 使用 RBAC 确保对 API 服务器的访问安全。
展示如何为 istiod 提供身份验证和授权的 Kubernetes API 权限资源。
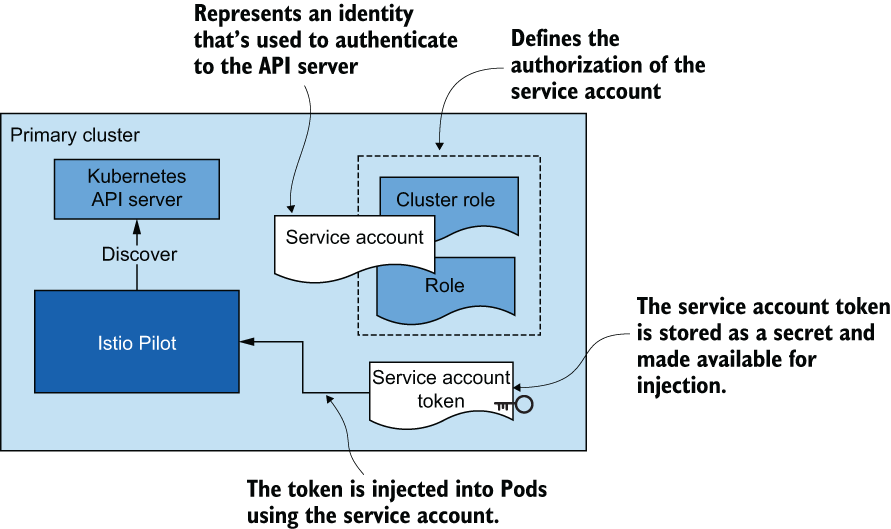
- 我们需要向
istiod提供远程群集的 SA 令牌(以及启动与 API 服务器的安全连接所需的集群证书),istiod使用该令牌对远程集群进行身份验证,并发现其中运行的工作负载。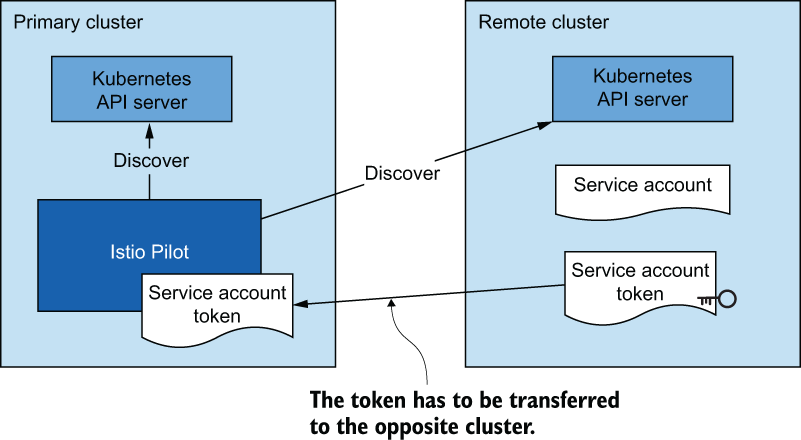
跨群集工作负载连接性#
当集群位于扁平网络中时,工作负载可以使用 IP 地址进行连接,因此条件已经满足!但是,当集群位于不同的网络中时,我们必须使用位于网格的特殊 Istio 入口网关来代理跨集群流量。搭建桥梁的入口网关被称为
east-west gateway
集群之间的共同信任#
多群集服务网格中的群集必须具有共同信任。有了共同信任,才能确保相对集群的工作负载能够相互验证。在相对集群的工作负载之间实现共同信任有两种方法。第一种方法是使用我们所说的插件 CA 证书:由共同根 CA 签发的用户自定义证书。第二种方法是集成一个外部 CA,两个集群都使用它来签署证书。
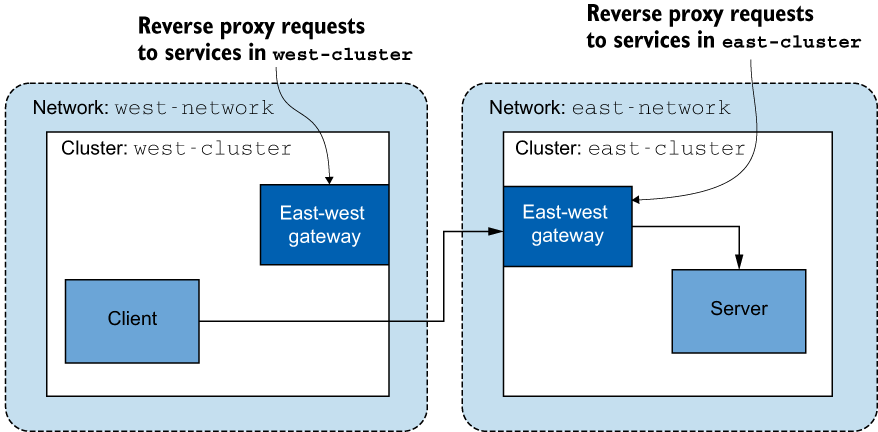
插件 CA 证书
使用插件中间 CA 证书非常简单!无需让 Istio 生成中间 CA,只需在 Istio 安装命名空间中将其作为秘密提供,即可指定要使用的证书。
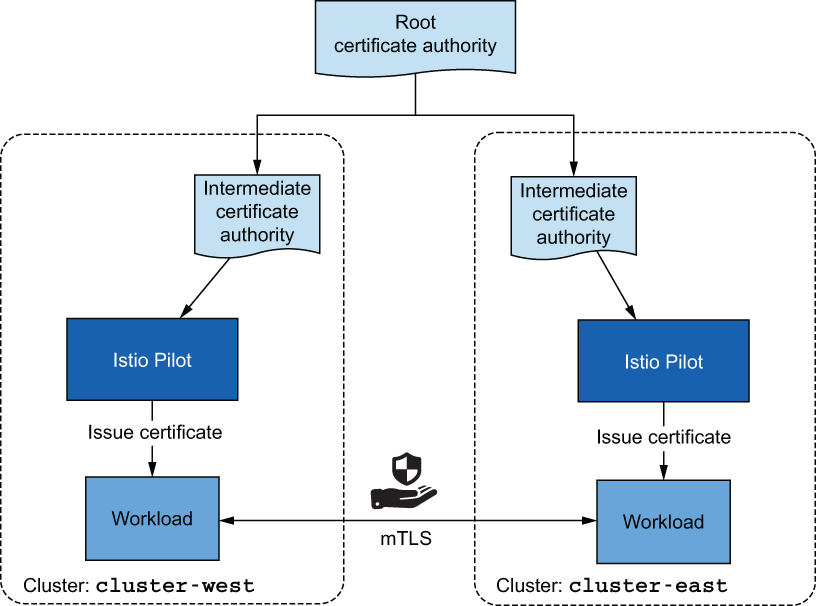
使用由同一根 CA 签发的中间 CA 证书
这种方法因其简单性而受到青睐,但如果中间 CA 暴露,则会带来安全风险。攻击者可以利用它们签署受信任的证书,直到暴露被发现,中间 CA 的证书被吊销。解决暴露的方法
- 只将中间 CA 加载到内存中
- 集成一个外部 CA 来签署证书
外部证书颁发机构集成
- cert-manager: 托管 CA 需要受 cert-manager 支持才行。
- https://cert-manager.io/docs/configuration/external/
- https://tetratelabs.io/istio-ca-certs-integrations/cert-manager-integration/
- 定制开发: 创建一个 Kubernetes 控制器,监听已批准的 Kubernetes CSR,并将其提交给外部 CA 进行签署。
多群集、多网络、多控制面服务网格概述#
基础架构环境说明
- west-cluster: cluster-1
- east-cluster: cluster-2
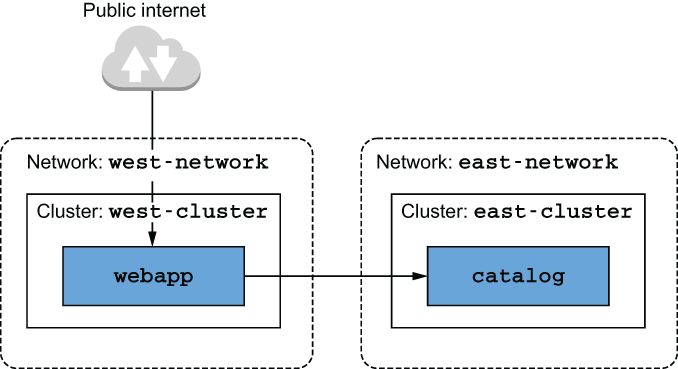
选择多群集部署模式
模式选择,取决于业务需求。
集群准备#
由于
azure试用账号被我之前玩没了,我这里就使用 RKE & Terraform 创建两套相互隔离的集群作为环境,大致图如下。
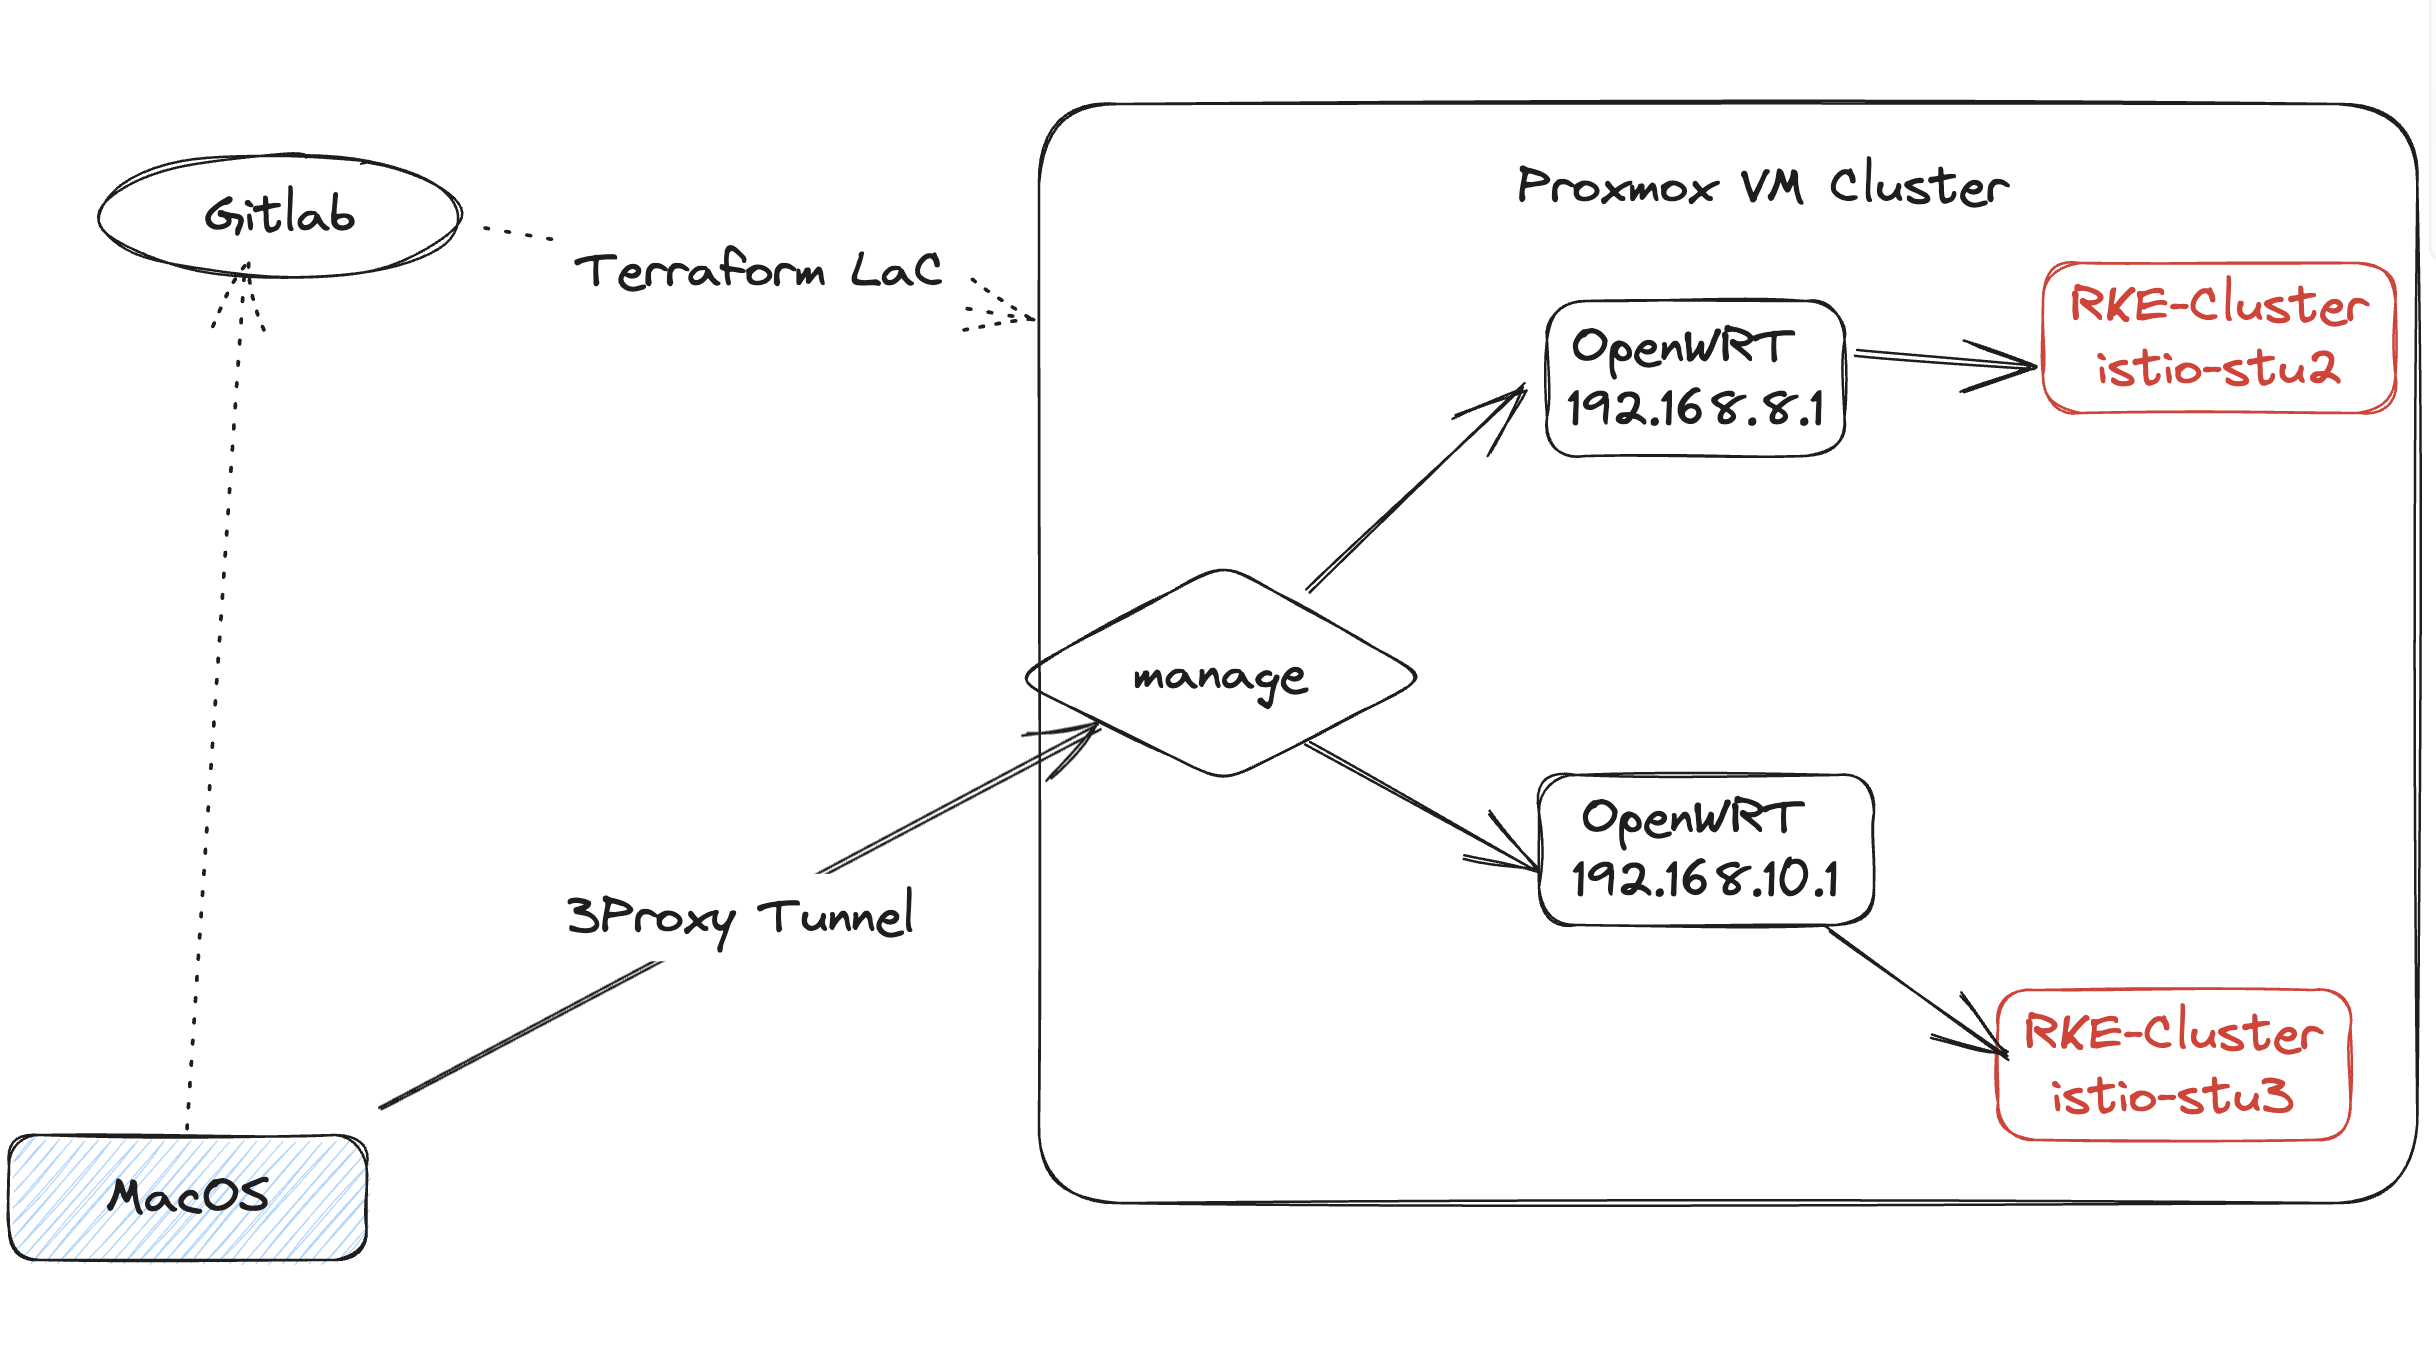
kubectl --context="istio-study-2" get pods -n kube-system
kubectl --context="istio-study-3" get pods -n kube-system

alias kwest='kubectl --context="istio-study-2"'
alias keast='kubectl --context="istio-study-3"'

# 为 west 集设置证书
kwest create namespace istio-system
kwest create secret generic cacerts -n istio-system \
       --from-file=ch12/certs/west-cluster/ca-cert.pem \
       --from-file=ch12/certs/west-cluster/ca-key.pem \
       --from-file=ch12/certs/root-cert.pem \
       --from-file=ch12/certs/west-cluster/cert-chain.pem

# 为 east 群集设置证书
keast create namespace istio-system
keast create secret generic cacerts -n istio-system \
       --from-file=ch12/certs/east-cluster/ca-cert.pem \
       --from-file=ch12/certs/east-cluster/ca-key.pem \
       --from-file=ch12/certs/root-cert.pem \
       --from-file=ch12/certs/east-cluster/cert-chain.pem
在每个群集安装控制平面
为每个集群标记 topology 标签。另外一种方法
https://istio.io/latest/docs/reference/config/istio.mesh.v1alpha1/#MeshNetworks
kwest label namespace istio-system \
     topology.istio.io/network=west-network

keast label namespace istio-system \
     topology.istio.io/network=east-network
# 使用  IstioOperator 安装 istiod

apiVersion: install.istio.io/v1alpha1
metadata:
 name: istio-controlplane
 namespace: istio-system
kind: IstioOperator
spec:
  profile: demo
  components:
    egressGateways:                ❶ 禁用出口网关
    - name: istio-egressgateway
      enabled: false
 values:
   global:
     meshID: usmesh                ❷ 网格名称
     multiCluster:
       clusterName: west-cluster   ❸ 多群组网格中的群组标识符
     network: west-network         ❹ 安装所在的网络

istioctl --context="istio-study-2" install -y \
     -f ch12/controlplanes/cluster-west.yaml

istioctl --context="istio-study-3" install -y \
      -f ch12/controlplanes/cluster-east.yaml

# 设置 istiod 别名
alias iwest='istioctl --context="istio-study-2"'
alias ieast='istioctl --context="istio-study-3"'
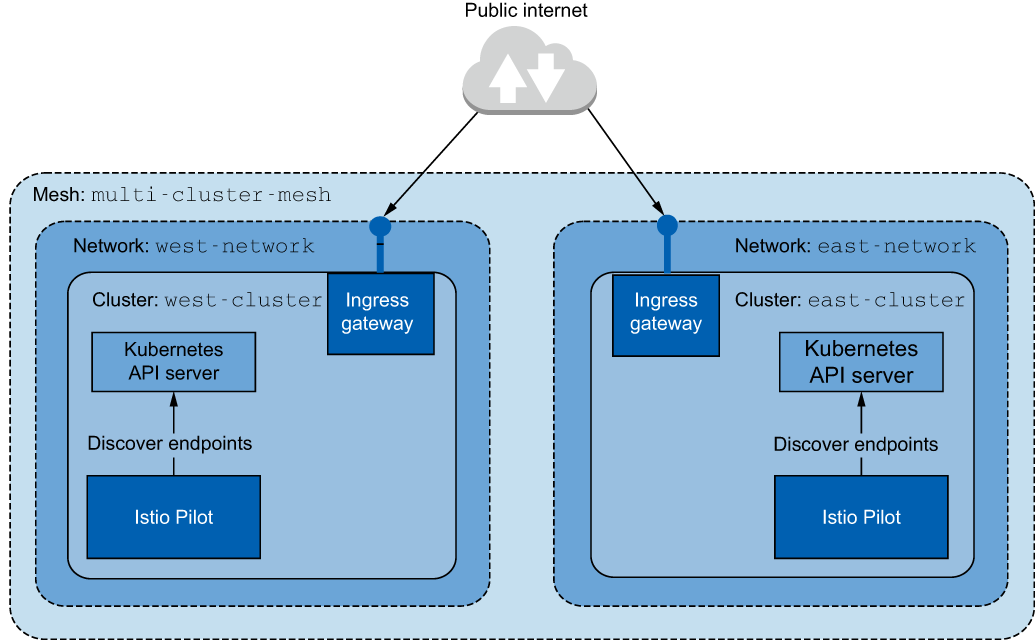
在两个集群上运行工作负载
kwest create ns istioinaction
kwest label namespace istioinaction istio-injection=enabled
kwest -n istioinaction apply -f ch12/webapp-deployment-svc.yaml
kwest -n istioinaction apply -f ch12/webapp-gw-vs.yaml
kwest -n istioinaction apply -f ch12/catalog-svc.yaml # 注意这里。catalog app 在 west 集群并不存在

# 在 east-cluster 中安装 catalog 服务
keast create ns istioinaction
keast label namespace istioinaction istio-injection=enabled
keast -n istioinaction apply -f ch12/catalog.yaml
启用跨群集工作负载发现#
要对 Istio 进行身份验证以查询远程群集的信息,它需要一个服务账户(SA)来定义其权限的身份和角色绑定。因此,Istio 会在安装时创建一个服务账户(名为
istio-reader-service-account),该账户具有最小权限集,可被另一个控制平面用于验证自身身份并查询服务和端点等工作负载相关信息。不过,我们需要向对面的群集提供服务帐户令牌以及证书,以启动与远程群集的安全连接。
为远程群集访问创建机密
ieast create-remote-secret \
  --name="east-cluster"

apiVersion: v1
kind: Secret
metadata:
  annotations:
    networking.istio.io/cluster: east-cluster
  creationTimestamp: null
  labels:
    istio/multiCluster: "true" #  Istio 的控制平面会监控此标签设置为 "true "的秘密,以注册新群集。
  name: istio-remote-secret-east-cluster
  namespace: istio-system
stringData:
  east-cluster: |
    apiVersion: v1
    clusters:
    - cluster:
        certificate-authority-data: <omitted>  # 用于启动与该群集的安全连接的 CA
        server: https://192.168.10.170:6443
      name: east-cluster
    contexts:
    - context:
        cluster: east-cluster
        user: east-cluster
      name: east-cluster
    current-context: east-cluster
    kind: Config
    preferences: {}
    users:
    - name: east-cluster
      user:
        token: <omitted> # 代表服务账户身份的令牌

---
# 注意这里,west 需要可以连接到 east 集群的 API Server
ieast create-remote-secret --name="east-cluster"|kwest apply -f -

# secret 创建后, istiod 会立即获取并查询新添加的远程集群中的工作负载。这将记录在 istiod 中。
kwest logs deploy/istiod -n istio-system | grep -A 3 'Adding cluster'
2023-10-02T13:44:59.812807Z     info    Adding cluster  cluster=east-cluster secret=istio-system/istio-remote-secret-east-cluster
2023-10-02T13:44:59.813966Z     info    initializing Kubernetes credential reader for cluster east-cluster
2023-10-02T13:44:59.814011Z     info    kube    Initializing Kubernetes service registry "east-cluster"
2023-10-02T13:44:59.814086Z     info    kube    Creating WorkloadEntry only config store for east-cluster
对于,主主部署,需要互相创建 Secret
iwest create-remote-secret --name="west-cluster"|keast apply -f -
设置跨群集连接
比之下,不同内部网络(例如我们的集群网络)之间的流量被称为东西向流量
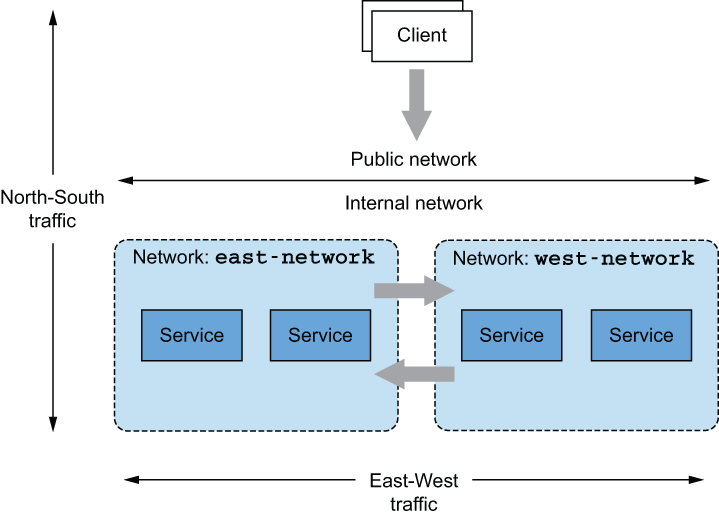
南北向和东西向 流量
为了简化东西向流量,只要网络地址空间不重叠,大多数云提供商都能实现虚拟网络的对等互联。对等虚拟网络中的服务使用 IPv4 和 IPv6 地址启动直接连接。不过,网络对等互联是云特有的功能。每当我们要连接不同云提供商或内部部署的集群时,如果无法实现网络对等互联,Istio 就会提供一个东西向网关。该网关必须与负载平衡器一起暴露在对面集群的工作负载中。
Istio 的东西门户
东西向网关的目标除了作为跨群集东西向流量的入口点外,还要使这一过程对维护的团队透明。为实现这一目标,网关必须
- 实现跨集群的细粒度流量管理
- 路由加密流量,实现工作负载之间的相互验证
使用 SNI 集群配置东西网关
东西网关是入口网关,为每项服务附加服务器名称指示(SNI)群组配置。什么是 SNI 群集?SNI 群集与普通的 Envoy 群集一样(,由方向、子集、端口和 FQDN 组成,将一组类似的工作负载组合在一起,流量可在其中路由。不过,SNI 群集有一个关键区别:它们在 SNI 中编码了所有 Envoy 群集信息。这样,东西网关就能将加密流量代理到客户在 SNI 中指定的群集。举个具体例子,当一个客户端(如
webapp-客户端(如catalog工作负载)启动与远程群集工作负载的连接时,会将目标群集编码到 SNI 中,如图 所示。集群信息被编码到 SNI 中。(2) SNI 包含决定路由决策的方向、端口、版本和服务名称。
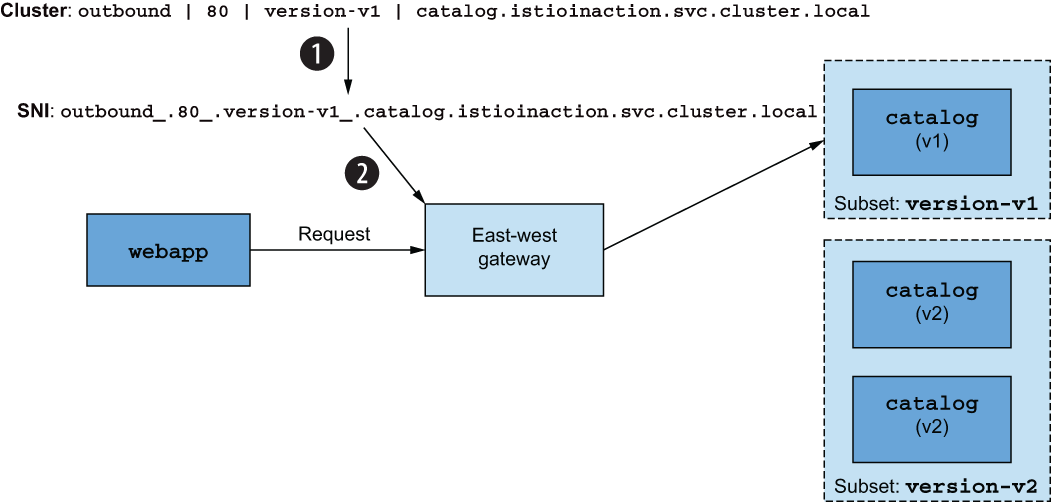
使用 SNI 群集安装东西网关
apiVersion: install.istio.io/v1alpha1
kind: IstioOperator
metadata:
  name: istio-eastwestgateway                          ❶  IstioOperator 名称不应与之前的 Istio 安装重叠。
  namespace: istio-system
spec:
  profile: empty                                       ❷  空配置文件不会安装其他 Istio 组件。
  components:
    ingressGateways:
    - name: istio-eastwestgateway                      ❸ 网关名称
      label:
        istio: eastwestgateway
        app: istio-eastwestgateway
      enabled: true
      k8s:
        env:
          - name: ISTIO_META_ROUTER_MODE               ❹ "sni-dnat "模式会添加代理流量所需的 SNI 群集。
            value: "sni-dnat"                          ❹
          - name: ISTIO_META_REQUESTED_NETWORK_VIEW    ❺ 网关路由流量的网络
            value: east-network                        ❺
        service:
          ports:
            # redacted for brevity
  values:
    global:
      meshID: usmesh                                   ❻  网格、群集和网络识别信息
      multiCluster:                                    ❻
        clusterName: east-cluster                      ❻
      network: east-network                            ❻
解读
IstioOperator资源的名称不得与最初用于安装控制平面的资源相同。如果使用相同的名称,先前的安装将被覆盖。- 将
ISTIO_META_ROUTER_MODE设置为sni-dnat可自动配置 SNI 群集。如果未指定,则退回到standard模式,即不配置 SNI 群集。 ISTIO_META_REQUESTED_NETWORK_VIEW定义代理的网络流量。
# 安装
ieast install -y -f ch12/gateways/cluster-east-eastwest-gateway.yaml
使用 SNI 自动直通功能路由跨集群流量#
要理解 SNI 自动直通,我们不妨回顾一下,手动 SNI 直通配置入口网关根据 SNI 标头接纳流量。由此可见,服务运营商必须手动定义
VirtualService资源,才能对接纳的流量进行路由。SNI 自动直通,顾名思义,不需要手动创建VirtualService来路由接纳的流量。路由器模式设置为sni-dnat时,东西网关会自动配置 SNI 群集。
使用 SNI 直通进行流量路由选择需要定义 VirtualService 资源
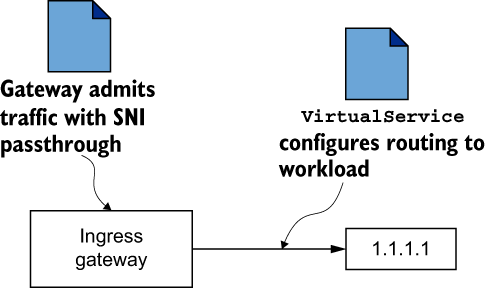
使用 SNI 自动直通的流量路由使用 SNI 群集,并以 sni-dnat 路由器模式初始化。
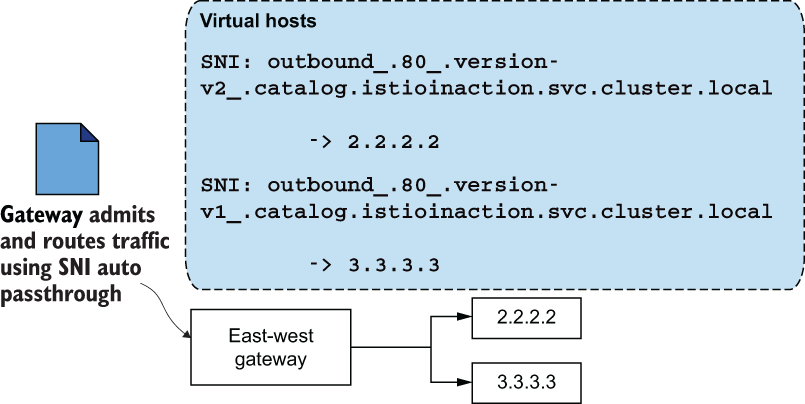
SNI 自动直通模式通过 Istio Gateway 资源进行配置。
# 将 SNI 自动直通用于 SNI 标头与表达式 *.local 匹配的所有流量。的所有流量都使用 SNI 自动直通,所有 Kubernetes 服务都是这种情况
apiVersion: networking.istio.io/v1alpha3
kind: Gateway
metadata:
  name: cross-network-gateway
  namespace: istio-system
spec:
  selector:
    istio: eastwestgateway        ❶ 配置仅应用于与选择器匹配的网关。
  servers:
    - port:
        number: 15443             ❷ 在 Istio 中,端口 15443 是为多群集 mTLS 流量指定的特殊端口。
        name: tls
        protocol: TLS
      tls:
        mode: AUTO_PASSTHROUGH    ❸  使用 SNI 标头确定目的地,并使用 SNI 集群
      hosts:
        - "*.local"               ❹ 仅接纳与 regex *.local 匹配的 SNI 的流量


# 将其应用到群集后, east-cluster 的工作负载就会暴露给 west-cluster
keast apply -n istio-system -f ch12/gateways/expose-services.yaml

# 在 west-cluster 中创建一个东西向网关,并将其服务暴露给 east-cluster 中的工作负载
iwest install -y -f ch12/gateways/cluster-west-eastwest-gateway.yaml
kwest apply -n istio-system -f ch12/gateways/expose-services.yaml

# 通过查询东西网关的群集代理配置,并将输出过滤为仅包含 catalog 文本的行来验证 SNI 群集是否已配置
ieast pc clusters deploy/istio-eastwestgateway.istio-system  \
    | grep catalog | awk '{printf "CLUSTER: %s\n", $1}'
CLUSTER: catalog.istioinaction.svc.cluster.local
CLUSTER: outbound_.80_._.catalog.istioinaction.svc.cluster.local # 用于目录服务的 SNI 集群
验证跨集群工作负载发现
# 获取 east-cluster 中 eastwestgateway 地址
keast -n istio-system get svc istio-eastwestgateway \
      -o jsonpath='{.status.loadBalancer.ingress[0].ip}'
192.168.10.210

# 将其与 west-cluster 中的工作负载在路由跨集群流量时使用的地址进行比较
iwest pc endpoints deploy/webapp.istioinaction | grep catalog

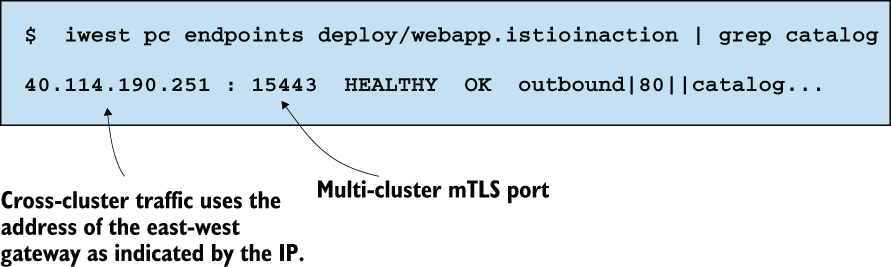
# 手动触发一个请求,进行最终验证
EXT_IP=$(kwest -n istio-system get svc istio-ingressgateway \
     -o jsonpath='{.status.loadBalancer.ingress[0].ip}')

curl http://$EXT_IP/api/catalog -H "Host: webapp.istioinaction.io"|jq
  % Total    % Received % Xferd  Average Speed   Time    Time     Time  Current
                                 Dload  Upload   Total   Spent    Left  Speed
100   357  100   357    0     0  16758      0 --:--:-- --:--:-- --:--:-- 21000
[
  {
    "id": 1,
    "color": "amber",
    "department": "Eyewear",
    "name": "Elinor Glasses",
    "price": "282.00"
  },
...
]
当我们向入口网关触发请求时,该请求被路由至 west-cluster 中的 webapp 。然后解析到 east-cluster 中的 catalog 工作负载。最终,east-cluster中的工作负载为请求提供了服务。
回顾一下建立多集群服务网格所需的条件
- 使用包含服务账户令牌和证书的
kubeconfig,让每个控制平面都能访问对等集群,从而发现跨集群工作负载。istioctl为这一过程提供了便利。我们仅将其应用于对等集群。 - 通过配置东西向网关,在不同集群(位于不同网络)的工作负载之间路由流量,并为每个集群标注网络信息,以便 Istio 知道工作负载所在的网络,从而实现跨集群工作负载连接。
- 通过使用共同的信任根来配置群集之间的信任,该信任根负责签发相对群集的中间证书。
跨群集负载均衡#
部署两个示例服务,每个服务都被配置为返回工作负载运行所在集群的名称。这样,我们就能轻松确定提供请求的工作负载的位置。
# 在 west-cluster 中部署第一个服务
$  kwest apply -f \                                     ❶ 在西群集部署一个简单的后端部署
ch12/locality-aware/west/simple-backend-deployment.yaml

$  kwest apply -f \
ch12/locality-aware/west/simple-backend-svc.yaml        ❷ 用于简单后端部署的 Kubernetes 服务

$  kwest apply -f \
ch12/locality-aware/west/simple-backend-gw.yaml         ❸ 应用网关资源以接纳流量

$  kwest apply -f \
ch12/locality-aware/west/simple-backend-vs.yaml         ❹ 应用 VirtualService 资源,将流量从网关路由到简单的后端工作负载

kwest apply -f \
ch12/locality-aware/west/simple-backend-deployment.yaml
kwest apply -f \
ch12/locality-aware/west/simple-backend-svc.yaml
kwest apply -f \
ch12/locality-aware/west/simple-backend-gw.yaml
kwest apply -f \
ch12/locality-aware/west/simple-backend-vs.yaml

# 立即向 west-cluster 中的服务发出请求,并看到它返回集群名称:
curl -s $EXT_IP -H "Host: simple-backend.istioinaction.io" | jq ".body"
"Hello from WEST"

# 在 east-cluster 中部署服务
keast apply -f ch12/locality-aware/east/simple-backend-deployment.yaml
keast apply -f ch12/locality-aware/east/simple-backend-svc.yaml
两个集群中运行服务后,在入口网关中配置其端点,并在它们之间对请求进行负载均衡
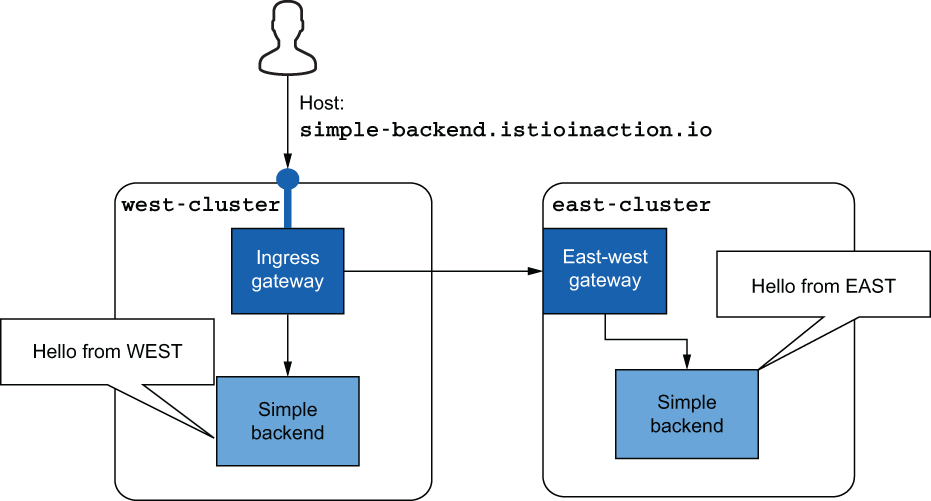
默认情况下,Istio 使用 round-robin 在工作负载之间进行负载平衡。
for i in {1..10}; do curl --max-time 5 -s $EXT_IP \
    -H "Host: simple-backend.istioinaction.io" | jq .body; done
"Hello from EAST"
"Hello from WEST"
...
使用
本地感知负载均衡可以进一步提高性能,这样工作负载就会优先将流量路由到其本地范围内的工作负载。前面的章节中提到,云提供商将本地信息作为标签添加到节点中。Istio 使用从标签中获取的这些信息来配置工作负载的本地性。
验证跨集群的本地感知路由选择
# 由于实验环境,非按书中公有云部署,我们手动添加为 node 打一下 region 标签
# https://istio.io/latest/docs/tasks/traffic-management/locality-load-balancing/
for node in $(kwest get nodes -o jsonpath='{.items[*].metadata.name}');do
	kwest label nodes $node topology.kubernetes.io/region=westus topology.kubernetes.io/zone=0 ;
done

kwest get nodes -o custom-columns="\
NAME:{.metadata.name},\
REGION:{.metadata.labels.topology\.kubernetes\.io/region},\
ZONE:{metadata.labels.topology\.kubernetes\.io/zone}"
NAME        REGION   ZONE
agent191    westus   0
agent192    westus   0
server190   westus   0

for node in $(keast get nodes -o jsonpath='{.items[*].metadata.name}');do
	keast label nodes $node topology.kubernetes.io/region=eastus topology.kubernetes.io/zone=0 ;
done

# 添加 lable 后,重新启动一下 istiod 即可。

iwest pc endpoints deploy/istio-ingressgateway.istio-system \
    --cluster \
    'outbound|80||simple-backend.istioinaction.svc.cluster.local' \
    -o json


[{
  "name": "outbound|80||simple-backend.istioinaction.svc.cluster.local",
  "addedViaApi": true,
  "hostStatuses": [
      {
          "address": <omitted>,
          "stats": <omitted>,
          "healthStatus": {
              "edsHealthStatus": "HEALTHY"
          },
          "weight": 1,
          "locality": {
              "region": "westus",    ❶ 西集群中工作负载的位置信息
              "zone": "0"            ❶
          }
      },
      {
          "address": <omitted>,
          "stats": <omitted>,
          "healthStatus": {
              "edsHealthStatus": "HEALTHY"
          },
          "weight": 1,
          "locality": {
              "region": "eastus",    ❷ 东集群中工作量的位置信息
              "zone": "0"            ❷
          }
      }
  ],
  "circuitBreakers": <omitted>
}]

# 应用目标规则,使用离群点检测来被动检查端点的健康状况
kwest apply -f ch12/locality-aware/west/simple-backend-dr.yaml


# 验证请求是否使用了定位信息,将流量执向同一集群内
for i in {1..10}; do curl --max-time 5 -s $EXT_IP \
      -H "Host: simple-backend.istioinaction.io" | jq .body; done
"Hello from WEST"
"Hello from WEST"
...

# 所有请求都会在 west-cluster 内路由。中路由,因为它离路由流量的入口网关最近。
iwest pc endpoints deploy/istio-ingressgateway.istio-system \
      --cluster \
      'outbound|80||simple-backend.istioinaction.svc.cluster.local' \
      -o json

[{
  "name": "outbound|80||simple-backend.istioinaction.svc.cluster.local",
  "addedViaApi": true,
  "hostStatuses": [
      {
          <omitted>
          "weight": 1,
          "locality": {
              "region": "westus",
              "zone": "0"
          }
      },
      {
          <omitted>
          "weight": 1,
          "priority": 1,    ❶ 第二台主机的优先级为 1
          "locality": {
              "region": "eastus",
              "zone": "0"
          }
      }
  ],
  "circuitBreakers": <omitted>
}]
看到了优先级字段,该字段指定了路由到该主机的流量优先级。最高优先级为 0。值为 1 的主机优先级较低,依此类推。当优先级最高的主机不可用时,流量就会被路由到优先级较低的主机。
验证跨群集故障切换
# 为了模拟简单后端部署失败,我们可以将环境变量 ERROR_RATE 设置为 1,从而将其配置为请求失败。
kwest -n istioinaction set env \
      deploy simple-backend-west ERROR_RATE='1'

---
# 一段时间后,异常点检测会检测到主机不健康,并将流量路由到 east-cluster 中的工作负载。
for i in {1..10}; do curl --max-time 5 -s $EXT_IP \
      -H "Host: simple-backend.istioinaction.io" | jq .body; done
"Hello from EAST"
"Hello from EAST"
"Hello from EAST"
"Hello from EAST"
"Hello from EAST"
"Hello from EAST"
...
使用授权策略验证跨集群访问控制
# 假设我们希望只有当流量来源是 Istio 的入口网关时,服务才会接纳该流量;否则,流量将被拒绝。
apiVersion: "security.istio.io/v1beta1"
kind: "AuthorizationPolicy"
metadata:
  name: "allow-only-ingress"
  namespace: istioinaction
spec:
  selector:
    matchLabels:
      app: simple-backend
  rules:
  - from:
    - source:
        principals: ["cluster.local/ns/istio-system/sa/istio-ingressgateway-service-account"]

# 在执行任何请求之前,我们先清理 west-cluster 中的服务,以便只有 east-cluster 中的实例才能为流量提供服务:
kwest delete deploy simple-backend-west -n istioinaction

# 触发 west-cluster 中工作负载的请求来测试策略
keast run -i -n default --rm --restart=Never sleep \
--image=curlimages/curl --command -- \
sh -c 'curl -s simple-backend.istioinaction.svc.cluster.local'
RBAC: access deniedpod "sleep" deleted

# 请求被拒绝。与此同时,向入口网关触发请求并从网关路由请求会得到成功响应
curl --max-time 5 -s $EXT_IP \
    -H "Host: simple-backend.istioinaction.io" | jq .body
"Hello from EAST"
多集群服务网格中的工作负载可以使用 Istio 的所有功能,而无需考虑它们在哪个集群中运行。而且不需要任何额外的配置。
虚拟机整合并至网格#
Istio 早期就支持将虚拟机集成到网格中,但这需要大量的变通方法和控制平面外部的自动化。Istio 的虚拟机支持在 Istio 1.9.0 中升级为测试版,其中一些关键功能已经实现,API 也确定了合适的方法。这些关键功能包括
- 使用
istioctl简化了虚拟机中 Sidecar 代理的安装和配置。 - 通过引入两个新的 Istio 资源,实现了虚拟机的高可用性:
WorkloadGroup和WorkloadEntry。 - 使用本地 DNS 代理(与 Istio 的 sidecar 一起安装),可以对虚拟机的网内服务进行 DNS 解析。
虚拟机中的旁路代理安装和配置#
要让虚拟机成为网格的一部分,我们需要
- 安装 Sidecar 代理管理网络流量
- 配置代理连接到
istiod并接收网格配置 - 为虚拟机提供身份令牌,用于向
istiod进行身份验证
任何工作负载成为网格一部分所需的先决条件。在 Kubernetes 中运行的工作负载也需要相同的步骤:
- 通过 webhook 或使用
istioctl自动安装和配置 Sidecar。 拥有身份令牌–Kubernetes 会自动将其注入 Pod。
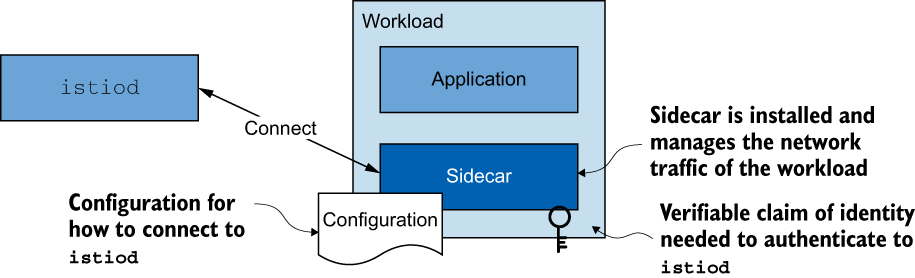
解虚拟机身份 Provisioning#
Istio 使用 Kubernetes 作为信任源来配置虚拟机的身份。具体做法是在 Kubernetes 中生成一个令牌,并将其传输到虚拟机。安装在机器中的
istio-agent会获取该令牌,并用于向istiod进行身份验证。
集群中的工作负载(1)获得注入 Pod 的服务帐户令牌,(2)使用令牌进行身份验证并检索 SVID。
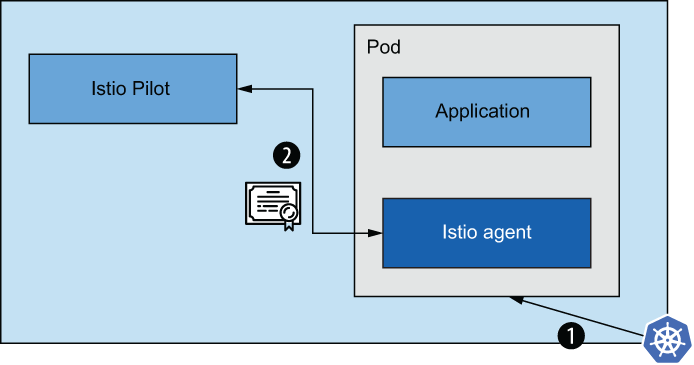
由于虚拟机是外部的,因此需要手动执行以下步骤:(1) 创建服务帐户;(2) 将令牌传输到虚拟机;(3) 使用令牌进行身份验证并接收 SVID。
这两种方法类似,唯一不同的是,Kubernetes 会自动将令牌注入 Pod。相比之下,对于虚拟机,这必须由服务网格操作员完成,他们必须手动将令牌安全地传输到虚拟机。
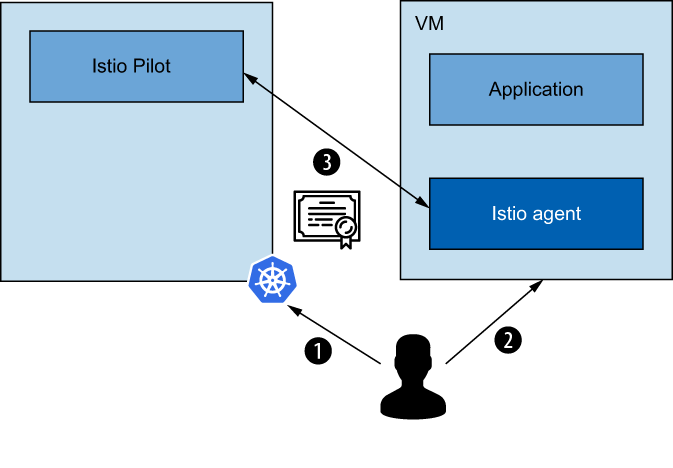
为不同云提供商的机器提供 自动的工作负载身份,改功能尚未开发
虚拟机高可用性#
为了实现虚拟机的高可用性,Istio 密切模仿了 Kubernetes 处理其容器化工作负载的方法。基本上,Kubernetes 通过以下资源实现高可用性:
Deployments 作为更高级别的资源,包含了复制创建方式的配置。Pods 是根据该配置创建的副本。这就确保了 Pod 没有任何独一无二之处,只要 Pod 不健康,就可以将其废弃或替换(或在不需要时将其缩减),从而保持服务的高可用性。Istio 为虚拟机引入的资源与 Kubernetes 的部署和 Pod 概念密切相关:
WorkloadGroup资源类似于 Kubernetes 的 “部署”(Deployments),因为它定义了如何配置其管理的工作负载的模板。WorkloadEntry类似于 Kubernetes Pod。它代表服务于终端用户流量的单个虚拟机。除了WorkloadGroup定义的通用属性外,WorkloadEntry还拥有独特的属性,如虚拟机的地址和健康状态。
WorkloadEntry可以手动创建,但建议使用工作负载自动注册,即新配置的工作负载自动加入网格。
WORKLOAD 自动注册
在工作负载自动注册过程中,工作负载会连接到控制平面(使用向其提供的配置),并使用身份令牌将 自己认证为 WorkloadGroup 的成员。注册成功后,控制平面将创建一个 WorkloadEntry 来代表网格中的虚拟机。
在网格中使用 WorkloadEntry 表示虚拟机非常重要,原因有很多。尤其是,Kubernetes 服务或 Istio ServiceEntry 资源可以使用标签选择器选择WorkloadEntry,并将其作为路由流量的后端。
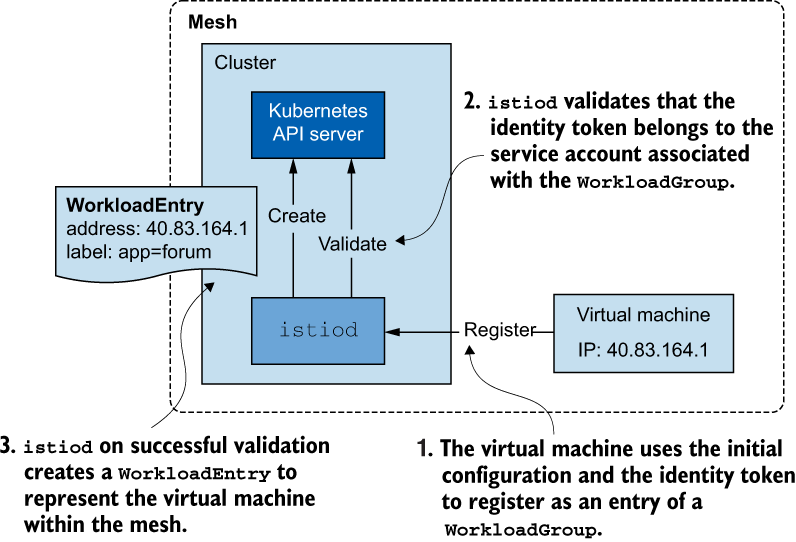
渐进式虚拟机流量迁移。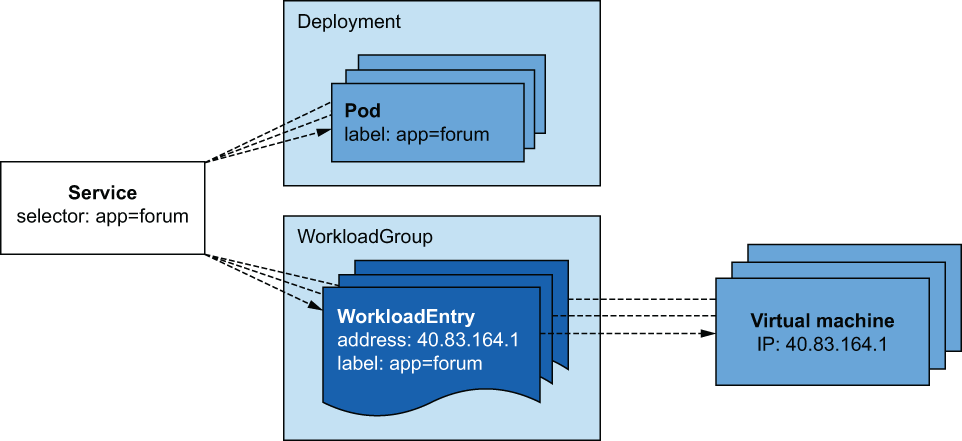
健康检查#
- Readiness
- Liveness
云厂商健康自检
- Azure 实现了虚拟机规模集的自动实例修复:http://mng.bz/0wrx。
- 亚马逊网络服务为自动扩展组实例实施健康检查:http://mng.bz/KB4K。
- Google Cloud Platform 为受管实例组实施健康检查和自动修复:http://mng.bz/9KNl。
ISTIO 如何在 VMS 中执行准备状态探测
- 根据
istio-agent定义中的规范,WorkloadGroup会定期探测应用程序是否已做好接收流量的准备。根据WorkloadGroup定义中的说明,定期探测应用程序是否已做好接收流量的准备。代理会向istiod报告应用程序的健康状态。
SIdecat proxy 向 istiod 更新,健康状态
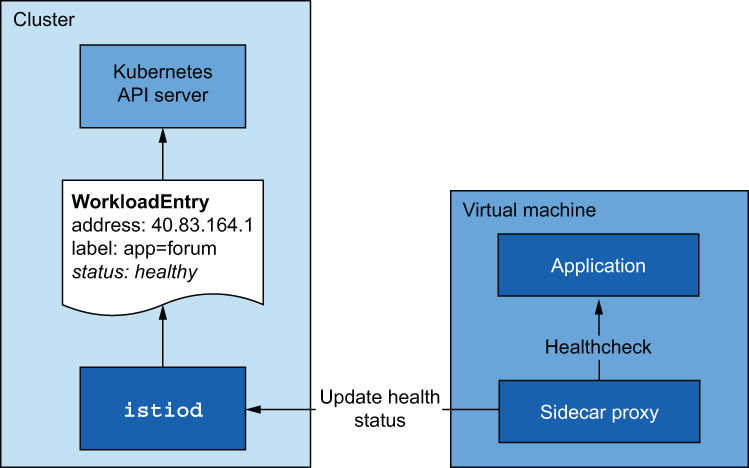
当应用程序处于健康状态时,数据平面会配置应用程序所在虚拟机的端点。反之亦然:当应用程序不健康时,端点会从数据平面中移除。
建议对有效性和就绪性探针使用不同的配置
istio-agent执行的就绪状态探测应积极主动,防止流量被路由到正在返回错误的实例。- 云提供商执行的有效性探测应更加
保守,并为虚拟机留出恢复时间。
尽量避免过于仓促地杀死实例,因为这样会在没有宽限期的情况下终止飞行中的请求,从而导致最终用户可见的故障。一个好的经验法则是,准备状态探测总是先于有效性探测失败。
服务的 DNS 解析#
由于虚拟机处于 Kubernetes 群集的外部,因此无法访问其内部 DNS 服务器。因此,虚拟机无法解析群集服务的主机名。
代理拥有如何路由流量的配置!然而,问题在于如何将流量从应用程序中导出并导入代理。实现这一点的前提条件是主机名已解析。否则,流量就无法离开应用程序,也就无法重定向到 Envoy 代理。
由于 DNS 解析失败,出站流量从未到达 Envoy 代理
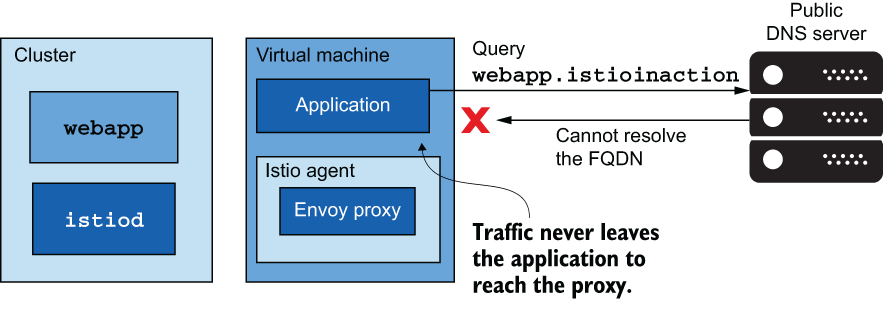
使用 Kubernetes 控制器自动配置私有 DNS 服务器,该控制器会监听这些变化并保持 DNS 服务器同步。 external-dns
(
1.8及以后版本)在istio-agent侧卡中引入了本地 DNS 代理,并通过istiod对所有网状服务进行了配置。DNS 代理在 Istio 的侧卡中与 Envoy 代理一起运行,处理来自应用程序的 DNS 查询,这些查询使用 Iptable 规则重定向到 DNS 代理,这也是 Istio 惯用的流量捕获方法。使用istio-cni时,情况略有不同。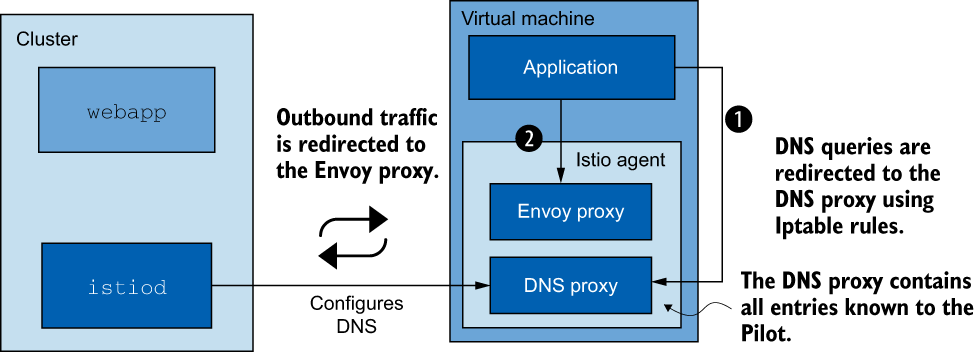
为了保持 DNS 代理的持续更新,Istio 引入了名为名称发现服务(NDS)的新 API。有了 NDS,每当 Kubernetes 服务或 Istio ServiceEntry 被添加到网格中时,控制平面就会将新的 DNS 条目同步到数据平面。
环境搭建#
我们将创建一个 Kubernetes 集群和一个虚拟机,用于托管我们的 cool-store 应用程序
webapp和catalogs服务部署在 Kubernetes 集群中。forum服务部署在虚拟机中。
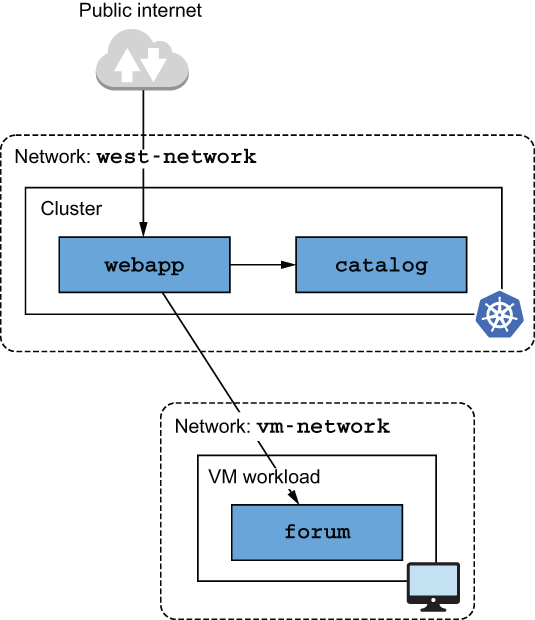
集群和虚拟机位于不同的网络中,这就需要一个
east-west gateway,以反向代理从虚拟机到集群服务的流量。
基于 Terraform 创建基础设施
module "istio-vm" {
  source = "git::https://gitlab-ee.treesir.pub/lac/terraform-proxmox-vm-rke-collection.git//?ref=main"
  cluster = {
    istio-vm = {
      server_group = {
        server1 = {
          vm_servers_list         = ["192.168.10.190"]
          vm_servers_memory       = "4096"
          vm_servers_cores        = "2"
          vm_servers_disk_size    = "40G"
          vm_servers_disk_storage = "sd"
          vm_servers_target_node  = "amd"
        }
      }
      agent_group = {
        agent1 = {
          vm_agents_list         = ["192.168.10.191", "192.168.10.192"]
          vm_agents_memory       = "8192"
          vm_agents_cores        = "4"
          vm_agents_disk_size    = "100G"
          vm_agents_disk_storage = "ew"
          vm_agents_target_node  = "amd"
        }
      }
      rke_enable_private_registry = false
      private_registry            = ""
      vm_ssh_port                 = "22"
      vm_ssh_user                 = "rke"
      vm_ssh_private_key          = "${path.root}/id_rsa"
      vm_ip_gw                    = "192.168.10.1"
      vm_pool                     = "devops"
      vm_clone_target             = "centos7"
      vm_ip_subnet                = "24"
      cluster_kubernetes_version  = "v1.26.4-rancher2-1"
      cluster_onboot              = "false"
    }
  }
  rke_user        = var.rke_user
  rke_user_passwd = var.rke_user_passwd
}


module "istio-forum-vm" {
  source = "git::https://gitlab-ee.treesir.pub/lac/terraform-proxmox-vm-collection.git//?ref=main"
  groups = {
    istio-forum-vm-8 = {
      desc              = "istio forum vm"
      target_node       = "amd"
      onboot            = true
      target_clone_name = "centos7"
      pool              = "devops"
      cores             = "2"
      memory            = "2048"
      ip                = "192.168.8.8"
      ip_gw             = "192.168.8.1"
      dns               = "192.168.8.1"
      disk_size         = "40G"
      storage           = "ew"
      ip_subnet         = "24"
    }
  }
  depends_on = [module.istio-vm]
}
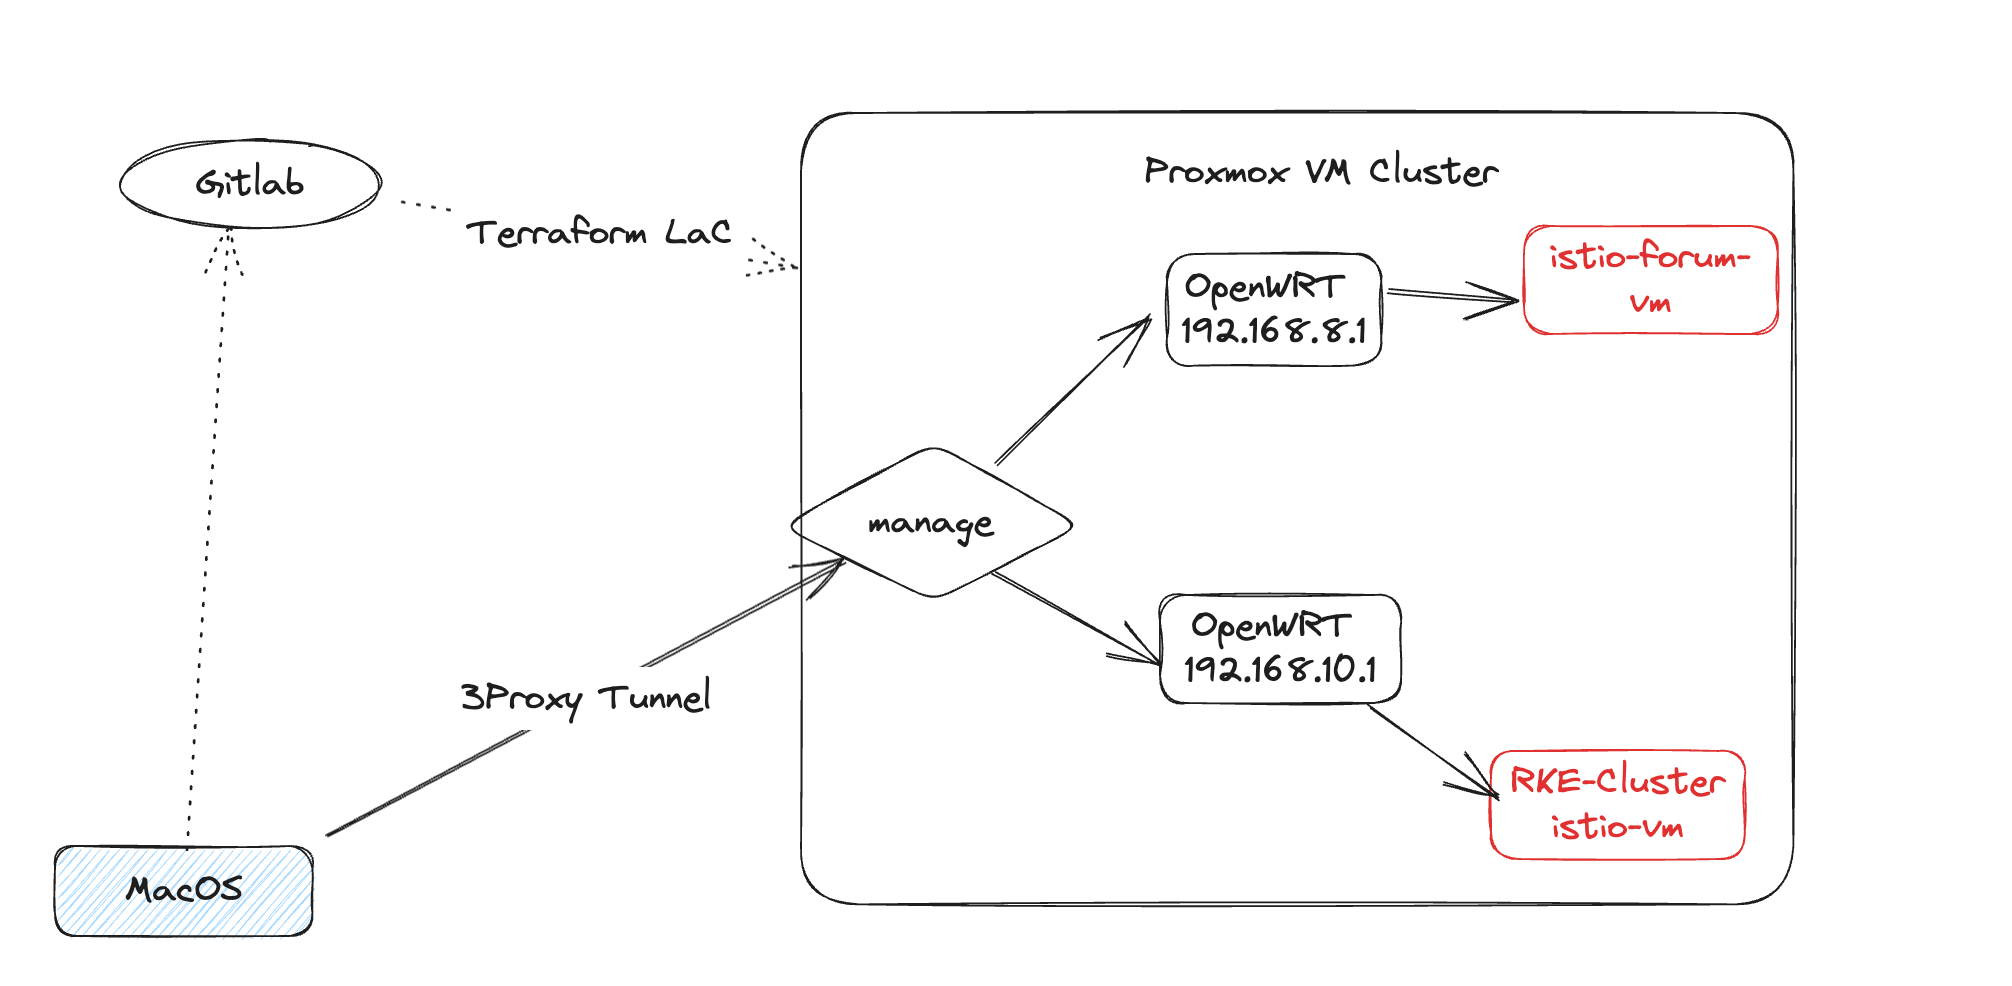
istio vm 集群初始化
# 安装 istiod

alias kvm='kubectl --context="istio-vm"'
alias ivm='istioctl --context="istio-vm"'

kvm create namespace istio-system
kvm label namespace istio-system \
     topology.istio.io/network=west-network

ivm install -y -f ch13/controlplane/cluster-in-west-network.yaml

kvm create ns istioinaction
kvm label namespace istioinaction \
      istio-injection=enabled

kvm -n istioinaction apply \
    -f ch12/webapp-deployment-svc.yaml
kvm -n istioinaction apply \
    -f ch12/webapp-gw-vs.yaml

kvm -n istioinaction apply \
    -f ch12/catalog.yaml
kube-vip 安装,实现 LoadBalancer
export VIP=192.168.10.99
export INTERFACE=eth0
docker pull plndr/kube-vip:v0.6.2
docker run --name vip --rm --net=host plndr/kube-vip:v0.6.2 \
manifest pod \
--interface $INTERFACE \
--vip $VIP \
--controlplane \
--services \
--arp \
--leaderElection | tee  /etc/kubernetes/manifests/kube-vip.yaml

# kube-vip-cloud-controller 安装
kvm apply -f https://raw.githubusercontent.com/kube-vip/kube-vip-cloud-provider/main/manifest/kube-vip-cloud-controller.yaml

# 配置 LoadBalancer 自助分配多IP段
cat << EOF |tr -s "n" | tee kubevip-cm.yaml | kvm apply -f -
apiVersion: v1
kind: ConfigMap
metadata:
  name: kubevip
  namespace: kube-system
data:
  range-global: 192.168.10.120-192.168.10.140
EOF
测试 istio vm 集群正常与否
EXT_IP=$(kvm -n istio-system get svc istio-ingressgateway -o \
       jsonpath='{.status.loadBalancer.ingress[0].ip}')
192.168.10.120

# 192.168.10.120 在 8.1 OpenWRT 中添加静态路由
route add -net 192.168.10.120/32 gw 192.168.1.31 # 1.31 为 10.1 WAN 口 IP

curl -H "Host: webapp.istioinaction.io" \
      http://$EXT_IP/api/catalog/items/1

配置虚拟机#
VM_IP=192.168.8.8
chmod 600 ch13/keys/id_rsa
ssh -i ch13/keys/id_rsa root@$VM_IP -- ls -la


# 由于使用自有私有云,forum 服务,我们使用 traefik/whoami 代替,并使其监听在 80 端口。
wget -O forum https://git.io/J3QrT

chmod a+x forum

nohup ./forum &
将网格扩展到虚拟机#
集成虚拟机的功能还处于测试阶段 1 ,默认情况下尚未启用。因此,我们需要使用以下
IstioOperator定义更新 Istio 安装,启用以下功能:工作负载自动注册、健康检查、捕获 DNS 查询并将这些查询重定向到 DNS 代理。
apiVersion: install.istio.io/v1alpha1
metadata:
  name: istio-controlplane
  namespace: istio-system
kind: IstioOperator
spec:
  profile: demo
  components:
    egressGateways:
    - name: istio-egressgateway
      enabled: false
  meshConfig:
    defaultConfig:
      proxyMetadata:
        ISTIO_META_DNS_CAPTURE: "true"                        ❶ DNS 查询被捕获并重定向到 DNS 代理。
  values:
    pilot:
      env:
        PILOT_ENABLE_WORKLOAD_ENTRY_AUTOREGISTRATION: true    ❷ 工作负载可自动注册到控制平面。
        PILOT_ENABLE_WORKLOAD_ENTRY_HEALTHCHECKS: true        ❸ 对虚拟机中的工作负载进行健康检查。
    global:
      meshID: usmesh
      multiCluster:
        clusterName: west-cluster
      network: west-network

ivm install -y -f \
     ch13/controlplane/cluster-in-west-network-with-vm-features.yaml
向虚拟机提供等效和群集服务#
要成为网格结构的一部分,虚拟机必须能够与
istiod对话,并启动与群集服务的连接。当虚拟机和群集位于同一网络时,这种方式就能正常工作;案例中,虚拟机和群集位于不同的网络,需要一个 east-west-gw 将流量代理到 Istio 控制平面或工作负载。
ivm install -y -f ch13/gateways/cluster-east-west-gw.yaml
安装网关后,我们就可以为虚拟机暴露访问群集服务和 istiod 所需的端口。
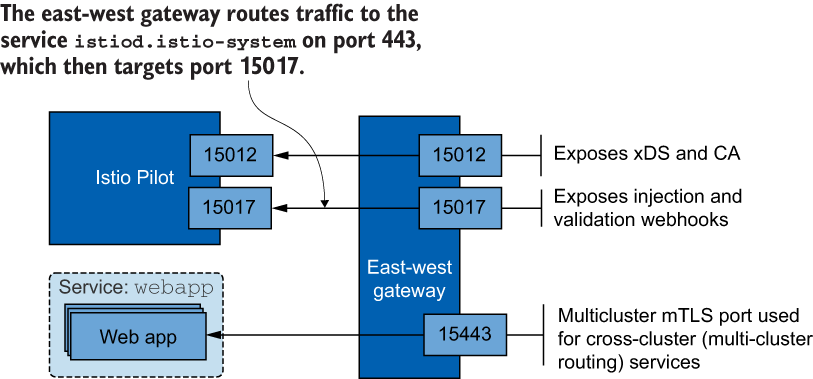
kvm apply -f ch13/expose-services.yaml
向虚拟机暴露 istiod 和群集服务的端口
# 通过应用 Gateway 资源和 VirtualService 资源来接收流量并将其路由到 istiod 来暴露 istiod 端口。
kvm apply -f ch13/expose-istiod.yaml
使用 WorkloadGroup 表示一组工作负载#
apiVersion: networking.istio.io/v1alpha3
kind: WorkloadGroup
metadata:
  name: forum
  namespace: forum-services
spec:
  metadata:
    annotations: {}
    labels:
      app: forum                   # 服务可使用标签锁定该组中的工作负载。
  template:
    ports:
      http: 8080
    serviceAccount: forum-sa       # 验证工作负载是否拥有来自 forum-sa 的验证令牌,以便注册到该工作负载组中
    network: vm-network            # 使 Istio 能够配置同一网络中工作负载之间的直接访问
  probe:                           # 在该工作负载组实例中运行的 istio-agent 会通过 8080 端口和 /api/healthz 路径上的 HTTP GET 请求检查应用程序的就绪状态。
    periodSeconds: 5
    initialDelaySeconds: 1
    httpGet:
      port: 8080
      path: /api/healthz
kvm create namespace forum-services
kvm create serviceaccount forum-sa -n forum-services
kvm apply -f ch13/workloadgroup.yaml

# 现在,群集已配置为自动注册工作负载,这些工作负载可以代表 WorkloadGroup 中指定的 SA forum-sa 的有效令牌。
生成虚拟机 Sidecar 配置
istioctl x workload entry configure \
    --name forum \                       ❶ 从 forum-services 命名空间中名为 forum 的 WorkloadGroup 生成工作负载配置
    --namespace forum-services \         ❶
    --clusterID "west-cluster" \         ❷ 必须设置为 Istio 安装时指定的群集名称
    --externalIP $VM_IP \                ❸ 当工作负载与群集不在同一网络中时,需要使用 workloadIP 参数。如果默认未定义,则使用网络分配给它的私有 IP。
    --autoregister \                     ❹ 设置配置以自动注册工作负载
    -o ./ch13/workload-files/            ❺ 与执行命令的位置相对应的存储配置文件的目录


VM_IP=192.168.8.8
ivm x workload entry configure \
    --name forum \
    --namespace forum-services \
    --clusterID "west-cluster" \
    --externalIP $VM_IP \
    --autoregister \
    -o ./ch13/workload-files/
Warning: a security token for namespace "forum-services" and service account "forum-sa" has been generated and stored at "ch13/workload-files/istio-token"
Configuration generation into directory ./ch13/workload-files/ was successful
生成的配置,这些文件中包含
east-west gateway的暴露istiod的 IP 地址。- 根证书,以验证
istiod提交的证书的真实性。 - 用于验证论坛会员身份的服务帐户令牌
WorkloadGroup到istiod. WorkloadGroup中定义的有关服务网格、网络和通用属性的配置。
将生成的文件传输到虚拟机
scp -i ch13/keys/id_rsa \
  -r ./ch13/workload-files/* root@$VM_IP:/root/

# istio-agent yum install
curl -LO https://storage.googleapis.com/istio-release/releases/1.19.1/rpm/istio-sidecar.rpm
sudo rpm -i istio-sidecar.rpm


mkdir -p /etc/certs
\cp \
    "${HOME}"/root-cert.pem /etc/certs/root-cert.pem
mkdir -p /var/run/secrets/tokens
\cp "${HOME}"/istio-token \
    /var/run/secrets/tokens/istio-token
\cp "${HOME}"/cluster.env \
    /var/lib/istio/envoy/cluster.env
\cp \
    "${HOME}"/mesh.yaml /etc/istio/config/mesh

cat "${HOME}"/hosts | \
    sudo sh -c 'cat >> /etc/hosts'

# 当前 IP 与 主机名称绑定
echo "$(hostname --all-ip-addresses | cut -d ' ' -f 1) $(hostname)" | \
 sudo sh -c 'cat >> /etc/hosts'
启动代理
# 启动代理前的最后一步是赋予其读写目录的所有者权限:
sudo mkdir -p /etc/istio/proxy

sudo chown -R istio-proxy /var/lib/istio \
    /etc/certs /etc/istio/proxy /etc/istio/config \
    /var/run/secrets /etc/certs/root-cert.pem

systemctl enable istio --now
检查代理日志
- 标准输出通道写入文件 /var/log/istio/istio.log
- 标准错误通道写入文件 /var/log/istio/istio.err.log
cat /var/log/istio/istio.log | grep xdsproxy
2023-10-05T04:37:04.364701Z	info	xdsproxy	Initializing with upstream address "istiod.istio-system.svc:15012" and cluster "west-cluster"
2023-10-05T04:37:04.410387Z	info	xdsproxy	connected to upstream XDS server: istiod.istio-system.svc:15012
列出 forum-services 名称空间中的工作负载条目来验证这一下
kvm get workloadentry -n forum-services
NAME                           AGE   ADDRESS
forum-192.168.8.8-vm-network   44m   192.168.8.8
将流量路由到群集服务#
[root@istio-forum-vm-8 ~]# curl webapp.istioinaction/api/catalog/items/1
{"id":1,"color":"amber","department":"Eyewear","name":"Elinor Glasses","price":"282.00"}
请求得到服务的过程
- 流量要离开应用程序,就必须解析其主机名。为此,DNS 查询必须重定向到 DNS 代理。
- 将名称解析为 IP 地址后,应用程序就能触发出站请求,并通过 Iptable 规则重定向到 Envoy 代理。
- Envoy 代理将流量路由到 east-west gateway
- east-west gateway 将请求代理给
webapp,由webapp查询项目。,该网关会向catalog服务查询项目。
流量如何到达群集服务
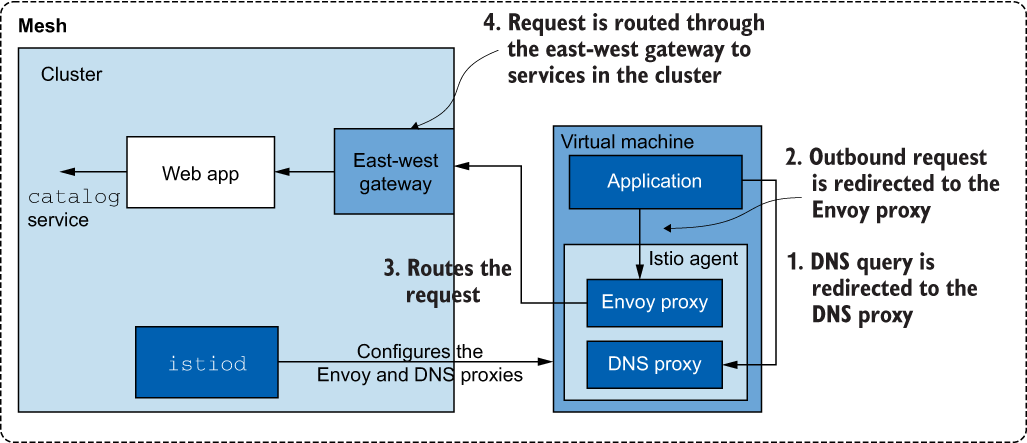
将流量路由到工作负载#
必须创建一个 Kubernetes 服务,使用标签选择实例,并让 Istio 用正确的 IP 地址动态配置所有服务。例如,为了选择 forum 工作负载条目,我们使用了以下 Kubernetes 服务:
apiVersion: v1
kind: Service
metadata:
  labels:
    app: forum
  name: forum
spec:
  ports:
  - name: http
    port: 80
    protocol: TCP
    targetPort: 8080
  selector:
    app: forum


kvm apply -f services/forum/kubernetes/forum-svc.yaml \
      -n forum-services

# 创建服务后, WorkloadEntry 端点将被选中, istiod 将通过它配置数据平面。我们可以通过向 forum 服务发出请求来轻松验证这一点
EXT_IP=$(kvm -n istio-system get svc istio-ingressgateway -o \
      jsonpath='{.status.loadBalancer.ingress[0].ip}')
curl -is -H "Host: webapp.istioinaction.io" \
      http://$EXT_IP/api/users | grep HTTP
HTTP/1.1 500 Internal Server Error


# 检查日志
kvm -n istioinaction logs deploy/webapp -c istio-proxy | tail -2
[2023-10-05T04:50:49.931Z] "GET /api/users HTTP/1.1" 200 - via_upstream - "-" 0 716 7 6 "192.168.10.190" "beegoServer" "c8adce51-d210-4695-b6f8-d2ecf3dff6fb" "forum.forum-services:80" "192.168.8.8:80" outbound|80||forum.forum-services.svc.cluster.local 10.42.8.7:40796 10.43.62.157:80 192.168.10.190:0 - default
[2023-10-05T04:50:49.928Z] "GET /api/users HTTP/1.1" 500 - via_upstream - "-" 0 27 10 10 "192.168.10.190" "curl/8.1.2" "c8adce51-d210-4695-b6f8-d2ecf3dff6fb" "webapp.istioinaction.io" "10.42.8.7:8080" inbound|8080|| 127.0.0.6:37817 10.42.8.7:8080 192.168.10.190:0 outbound_.80_._.webapp.istioinaction.svc.cluster.local default


# 检查端点
ivm proxy-config endpoints deploy/webapp.istioinaction | \
       grep forum
192.168.8.8:8080                                        HEALTHY     OK                outbound|80||forum.forum-services.svc.cluster.local

# 再次测试
curl -is -H "Host: webapp.istioinaction.io" \
      http://$EXT_IP/api/users | grep HTTP
HTTP/1.1 200 OK
虚拟机由控制平面配置:强制执行相互验证#
curl -is 192.168.8.8:8080/api/users | grep HTTP
HTTP/1.1 200 OK

# 在服务网格中配置一个全网格策略,只为经过相互验证的流量提供服务,从而保护我们的服务免受未经授权的访问
apiVersion: security.istio.io/v1beta1
kind: PeerAuthentication
metadata:
  name: default
  namespace: istio-system
spec:
  mtls:
    mode: STRICT

kvm apply -f ch13/strict-peer-auth.yaml


# 此时再次请求时,已无响应
curl -is 192.168.8.8:8080/api/users | grep HTTP

# 请求网格网关,却可以
curl -is -H "Host: webapp.istioinaction.io" \
      http://$EXT_IP/api/users | grep HTTP
HTTP/1.1 200 OK
解密 DNS 代理#
DNS 代理如何解析群集主机名#
- 客户端通过 DNS 查询解析
webapp.istioinaction - 操作系统处理 DNS 解析。它首先会检查主机名是否与主机文件中定义的任何条目相匹配。如果不匹配,则将请求转发给默认 DNS 解析器。
istio-agent配置了 Iptable 规则,将请求重定向至 DNS 代理,因此请求未到达系统解析器。- DNS 代理包含用于解析服务网格内已知服务的条目。如果主机名匹配,则会得到解析,
webapp.istioinaction就是这种情况,因为它是由控制平面使用 NDS 配置的。 - 否则,如果不是集群服务,DNS 代理会返回到 resolv.conf 文件中指定的 DNS,在那里进行解析或解析失败
流程图如下:
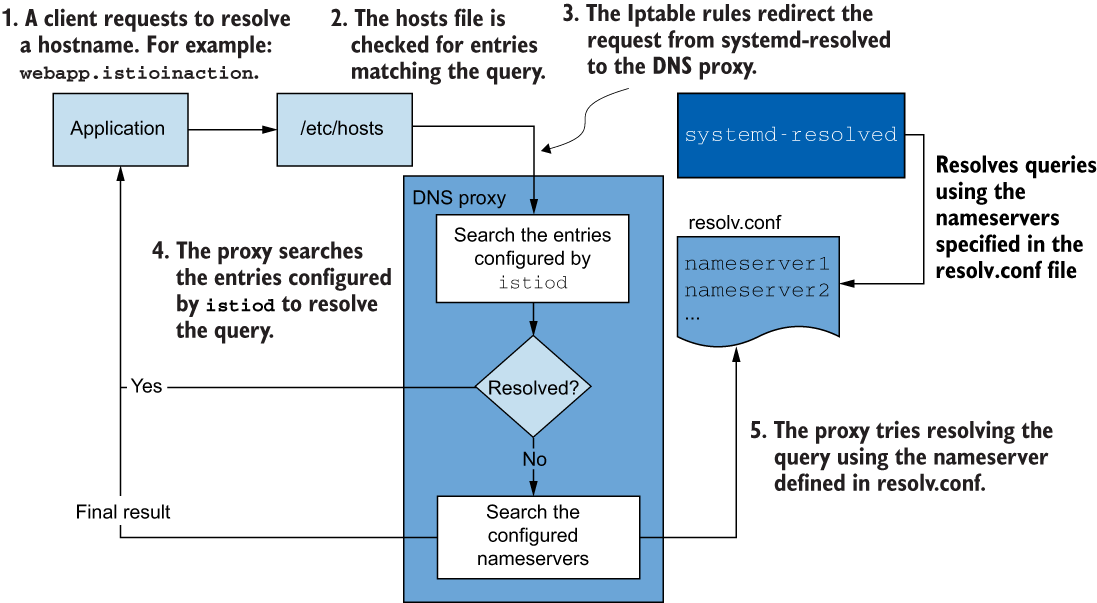
[root@istio-forum-vm-8 ~]# iptables-save | grep 'to-ports 15053'
-A OUTPUT -d 192.168.8.1/32 -p udp -m udp --dport 53 -j REDIRECT --to-ports 15053
-A ISTIO_OUTPUT -d 192.168.8.1/32 -p tcp -m tcp --dport 53 -j REDIRECT --to-ports 15053

# 输出结果中,我们看到流量被重定向到 DNS 代理端口。


[root@istio-forum-vm-8 ~]# netstat -ltunp
Active Internet connections (only servers)
Proto Recv-Q Send-Q Local Address           Foreign Address         State       PID/Program name
tcp        0      0 0.0.0.0:15090           0.0.0.0:*               LISTEN      7062/envoy
tcp        0      0 0.0.0.0:22              0.0.0.0:*               LISTEN      1174/sshd
tcp        0      0 127.0.0.1:15000         0.0.0.0:*               LISTEN      7062/envoy
tcp        0      0 0.0.0.0:15001           0.0.0.0:*               LISTEN      7062/envoy
tcp        0      0 127.0.0.1:15004         0.0.0.0:*               LISTEN      7054/pilot-agent
tcp        0      0 0.0.0.0:15006           0.0.0.0:*               LISTEN      7062/envoy
tcp        0      0 0.0.0.0:15021           0.0.0.0:*               LISTEN      7062/envoy
tcp        0      0 127.0.0.1:15053         0.0.0.0:*               LISTEN      7054/pilot-agent  #  istio-agent 正在监听端口
tcp        0      0 0.0.0.0:111             0.0.0.0:*               LISTEN      737/rpcbind
tcp6       0      0 :::22                   :::*                    LISTEN      1174/sshd
tcp6       0      0 :::15020                :::*                    LISTEN      7054/pilot-agent
tcp6       0      0 :::111                  :::*                    LISTEN      737/rpcbind
tcp6       0      0 :::8080                 :::*                    LISTEN      6458/./forum
udp        0      0 0.0.0.0:111             0.0.0.0:*                           737/rpcbind
udp        0      0 127.0.0.1:323           0.0.0.0:*                           747/chronyd
udp        0      0 127.0.0.1:15053         0.0.0.0:*                           7054/pilot-agent #  istio-agent 正在监听端口
udp        0      0 0.0.0.0:907             0.0.0.0:*                           737/rpcbind
udp6       0      0 :::111                  :::*                                737/rpcbind
udp6       0      0 ::1:323                 :::*                                747/chronyd
udp6       0      0 :::907                  :::*                                737/rpcbind


---
# 基于 dig 测试该代理 DNS
[root@istio-forum-vm-8 ~]# dig +short @localhost -p 15053 webapp.istioinaction
10.43.23.214 # 可以正常返回解析。
DNS 代理知道哪些主机名?#
ivm proxy-status  | awk '{print $1}'
NAME
catalog-5df8455c79-jlv6r.istioinaction
istio-eastwestgateway-6cd6bb8544-p94g8.istio-system
istio-forum-vm-8.forum-services
istio-ingressgateway-57cbdcb9d9-xv485.istio-system
webapp-5f5984d7d5-4p7qp.istioinaction

# 在检索 NDS 配置时,我们使用 proxyID 参数的名称。
kvm -n istio-system exec deploy/istiod \
      -- curl -Ls \
      "localhost:8080/debug/ndsz?proxyID=istio-forum-vm-8.forum-services"

{
  "resource": {
    "@type": "type.googleapis.com/istio.networking.nds.v1.NameTable",
    "table": {
      "catalog.istioinaction.svc.cluster.local": {
        "ips": [
          "10.43.94.148"
        ],
        "registry": "Kubernetes",
        "shortname": "catalog",
        "namespace": "istioinaction"
      },
      "forum.forum-services.svc.cluster.local": {
        "ips": [
          "10.43.62.157"
        ],
        "registry": "Kubernetes",
        "shortname": "forum",
        "namespace": "forum-services"
      },
      "ingress-nginx-controller-admission.ingress-nginx.svc.cluster.local": {
        "ips": [
          "10.43.107.78"
        ],
        "registry": "Kubernetes",
        "shortname": "ingress-nginx-controller-admission",
        "namespace": "ingress-nginx"
      },
      "istio-eastwestgateway.istio-system.svc.cluster.local": {
        "ips": [
          "10.43.84.94"
        ],
        "registry": "Kubernetes",
        "shortname": "istio-eastwestgateway",
        "namespace": "istio-system"
      },
      "istio-ingressgateway.istio-system.svc.cluster.local": {
        "ips": [
          "10.43.212.115"
        ],
        "registry": "Kubernetes",
        "shortname": "istio-ingressgateway",
        "namespace": "istio-system"
      },
      "istiod.istio-system.svc.cluster.local": {
        "ips": [
          "10.43.82.93"
        ],
        "registry": "Kubernetes",
        "shortname": "istiod",
        "namespace": "istio-system"
      },
      "kube-dns-upstream.kube-system.svc.cluster.local": {
        "ips": [
          "10.43.43.125"
        ],
        "registry": "Kubernetes",
        "shortname": "kube-dns-upstream",
        "namespace": "kube-system"
      },
      "kube-dns.kube-system.svc.cluster.local": {
        "ips": [
          "10.43.0.10"
        ],
        "registry": "Kubernetes",
        "shortname": "kube-dns",
        "namespace": "kube-system"
      },
      "kubernetes.default.svc.cluster.local": {
        "ips": [
          "10.43.0.1"
        ],
        "registry": "Kubernetes",
        "shortname": "kubernetes",
        "namespace": "default"
      },
      "metrics-server.kube-system.svc.cluster.local": {
        "ips": [
          "10.43.138.157"
        ],
        "registry": "Kubernetes",
        "shortname": "metrics-server",
        "namespace": "kube-system"
      },
      "webapp.istioinaction.svc.cluster.local": {
        "ips": [
          "10.43.23.214"
        ],
        "registry": "Kubernetes",
        "shortname": "webapp",
        "namespace": "istioinaction"
      }
    }
  }
}
当 istio-agent 接收到 NDS 配置时,它会生成在 Kubernetes 集群中配置的所有DNS 格式,例如
- webapp.istioinaction.svc.cluster.local
- webapp.istioinaction
- webapp.istioinaction.svc
总结
- DNS 代理由
istiod使用已知服务进行配置。 istio-agent会生成主机名的较短变体(以符合 Kubernetes 的经验)。
自定义代理配置#
代理有大量的配置选项:记录什么、如何格式化,以及诸如配置代理为获得证书而要求的证书有效期等行为。
- 将 DNS 代理的日志记录级别提高到 debug 级别。
- 将证书有效期缩短至 12 小时。
可以更新 /var/lib/istio/envoy/sidecar.env 文件,该文件用于特定于 sidecar 的配置
https://istio.io/latest/docs/reference/commands/pilot-agent/
ISTIO_AGENT_FLAGS="--log_output_level=dns:debug"
SECRET_TTL="12h0m0s"


# 配置重启生效
sudo systemctl restart istio
从网格中删除工作负载条目#
和虚拟机自动注册到网格中一样,当它被
删除时,也会被自动清理掉。
kvm get workloadentries -n forum-services
| 特点 | Kubernetes | 虚拟机 |
|---|---|---|
| 安装代理 | 使用 istioctl 手动注入或使用 webhook 自动注入 | 下载并手动安装 |
| 配置代理 | 在 Sidecar 中完成 | 使用 istioctl 从 WorkloadGroup 生成配置并通过代理传输到虚拟机 |
| 引导式工作量识别 | 服务账户令牌由 Kubernetes 机制注入 Pod | 手动将服务帐户令牌传输到虚拟机 |
| 健康检查 | 由 Kubernetes 执行就绪性和有效性探测。 | 准备状态探针在工作负载组中配置。 |
| 注册 | 由 Kubernetes 处理 | 将虚拟机自动注册为工作负载组成员 |
| DNS 解析 | 群集内 DNS 服务器用于解析群集内的 FQDN。DNS 代理是可选的。 | DNS 代理由 istiod 配置,解析 FQDN。 |
在请求路径上扩展 Istio#
Todos